
Foundation June 2017 Paper 2 Q29
29. A festival was held over 10 days.
An ice cream van was parked on the festival site each day.
The scatter diagram shows the number of people attending the festival on each of the days and the amount of money taken by the ice cream van.
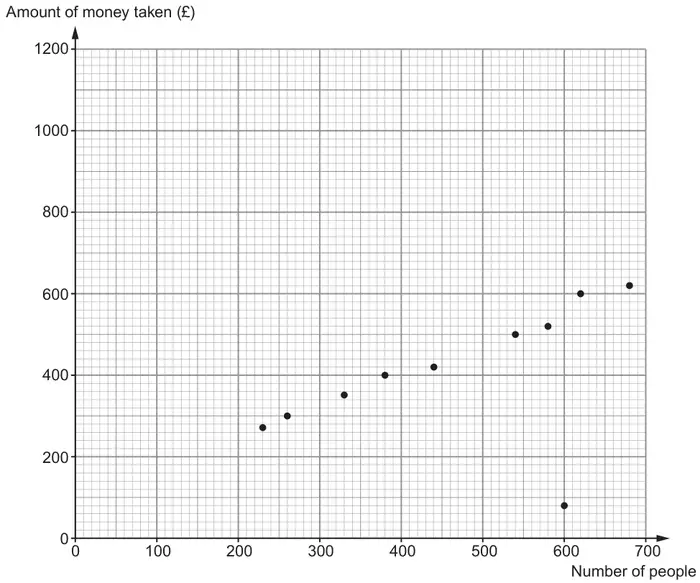
It was really cold and wet on one of the days.
Although lots of people attended on this day, the amount of money taken by the ice cream van was very low.
On this cold and wet day:
- how many people attended the festival?
- what was the amount of money taken by the ice cream van? [1]
Number of people ………………
Amount of money taken £ ………………
Estimate the amount of money that the ice cream van may have taken at the festival had only 50 people attended on a particular day. [1]
Estimate is £ ………………
Estimate how much each person attending the festival spends at the ice cream van.
You must give the unit of your answer. [1]
Estimate is ……………… per person
| Scheme | Marks | Comments |
|---|---|---|
| 600 (people) and (£) 80 | B1 |
| Scheme | Marks | Comments |
|---|---|---|
| Line of best fit | B1 | Following trend with points above and below Do not allow a line through (0, 0) |
| Scheme | Marks | Comments |
|---|---|---|
| (i) Answer in the range (£)100 to (£)160 | B1 | FT ‘their line of best fit’ |
| (ii) Reason, e.g. ‘might be cold’, ‘depends on the weather’, ‘no data around 50 people to use’, ‘extending the line assumes the trend follows a straight line’, ‘no evidence to support less than 230 people’, ‘the line wouldn’t pass through 0 people, £0’ | E1 | Allow, e.g. ‘not as many people, so they may not stay long and not buy ice cream’, ‘if 50 people went, spend of approximately £100 (or more) would be unreasonable’, ‘not enough data’ |
| Scheme | Marks | Comments |
|---|---|---|
| Answer in the range £0.65 to £1.20 or 65p to 120p with correct unit given | B1 | Do not accept in correct units, e.g. 0.87p Allow, e.g. £0.87p |
| (5) |