
Higher November 2023 Paper 2 Q20
20.
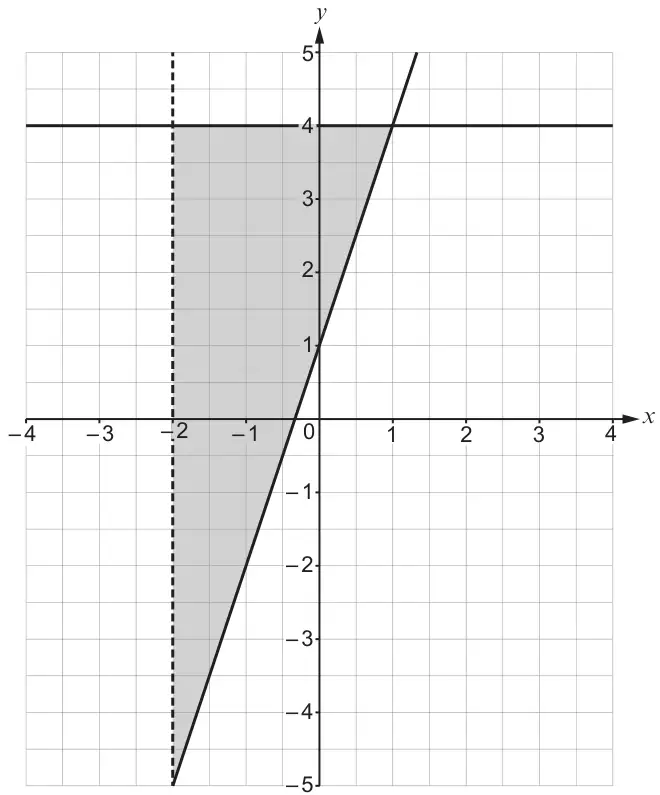
(a) Complete the following table to show the inequalities that describe the shaded region above. [3]
| \(y \leqslant 4\) |
(b) The line \(AB\) is shown on the diagram.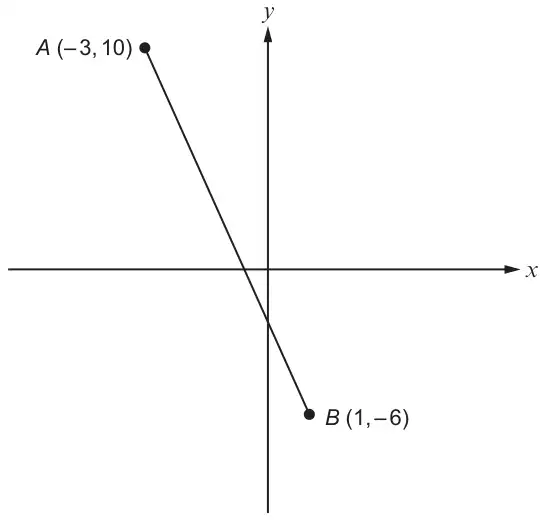
Diagram not drawn to scale
Show that the equation of the perpendicular bisector of the line \(AB\) is \(4y = x + 9\). [6]
| Scheme | Marks | Comments |
|---|---|---|
| \(x \gt -2\) | B1 | |
| \(y \geqslant 3x + 1\) | B2 | B1 for one of the following:
|
| Scheme | Marks | Comments |
|---|---|---|
| (Gradient of AB = ) \(-4\) | B1 | |
| (Gradient of perpendicular bisector = ) \(\frac{1}{4}\) | B1 | FT ‘their gradient of AB’ |
| (Mid-point of AB = ) \((-1,\ 2)\) | B1 | |
| \(y - 2 = \frac{1}{4}(x - (-1))\) or \(2 = \frac{1}{4} \times -1 + c\) oe | M1 | FT ‘their perpendicular bisector gradient’ and ‘their mid-point’ |
| \(4y - 8 = x + 1\) or \(y = \frac{1}{4}x + 2\frac{1}{4}\) oe or better | A1 | Allow any correct intermediate step. |
| for convincingly showing \(4y = x + 9\) | A1 | CAO |
| (9) |