
Higher November 2023 Paper 1 Q24
24. The velocity-time graph below shows the velocity of a car for the first 20 seconds from rest.
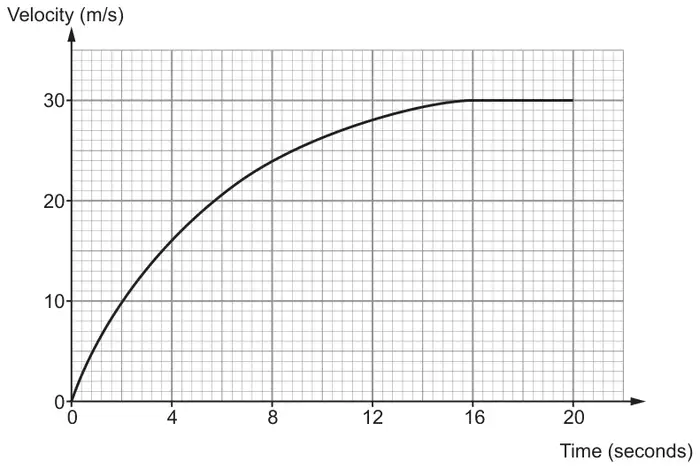
(a) Calculate an estimate of the acceleration of the car at time 8 seconds. [3]
(b) Use 5 vertical strips of equal width to calculate an estimate of the distance travelled by the car during the first 20 seconds of motion. [3]
| Scheme | Marks | Comments |
|---|---|---|
| Tangent drawn at time 8 seconds | M1 | |
| \(\dfrac{\text{Difference in y}}{\text{Difference in x}}\) | m1 | |
| Correctly evaluated gradient from their tangent | A1 | Accept answer written as an improper fraction (unless it gives a whole number), mixed number or decimal. If answer given as a decimal, it must be correct to 1 decimal place – rounded or truncated. |
| Scheme | Marks | Comments |
|---|---|---|
| \(\dfrac{0 + 16}{2}\times4 + \dfrac{16 + 24}{2}\times4 + \dfrac{24 + 28}{2}\times4 + \dfrac{28 + 30}{2}\times4 + \dfrac{30 + 30}{2}\times4\) \((32 + 80 + 104 + 116 + 120)\) | M2 | M1 for the sum of the areas of the 5 trapezia with one error - (possibly repeated) of the vertical heights used. Accept equivalent with vertical strips split into triangles and rectangles |
| = 452 (m) | A1 | FT from M1 |
| (6) |
Alternative method
| Scheme | Marks | Comments |
|---|---|---|
| \(\dfrac{1}{2}\times4\times(0 + 30 + 2(16 + 24 + 28 + 30))\) | M2 | Award M1 if only one value is incorrect. |
| = 452 (m) | A1 | FT from M1 |