
Higher November 2021 Paper 2 Q18
18. The diagram shows Zac’s height from 8 to 18 years of age.
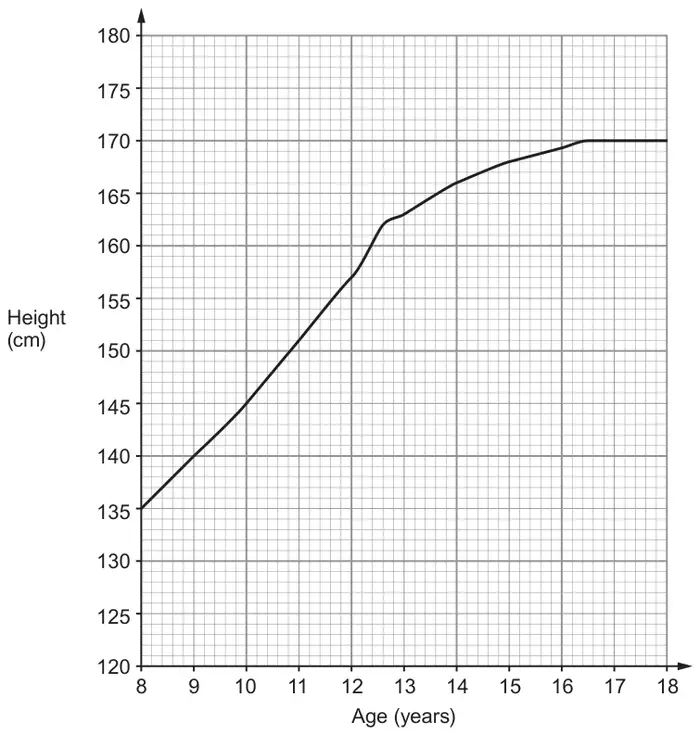
(a) Find Zac’s rate of growth on his 17th birthday. [1]
(b) What is Zac’s average rate of growth per year between his 10th and 15th birthdays?
You must show all your working. [3]
You must show all your working. [3]
| Scheme | Marks | Comments |
|---|---|---|
| 0 (cm per year) | B1 |
| Scheme | Marks | Comments |
|---|---|---|
| Gradient of the chord joining (10, 145) to (15, 168) \(\dfrac{168 - 145}{15 - 10}\) | M2 | M1 for the gradient of a chord with one point correct |
| 4.6 (cm per year) | A1 | CAO |
| (4) |