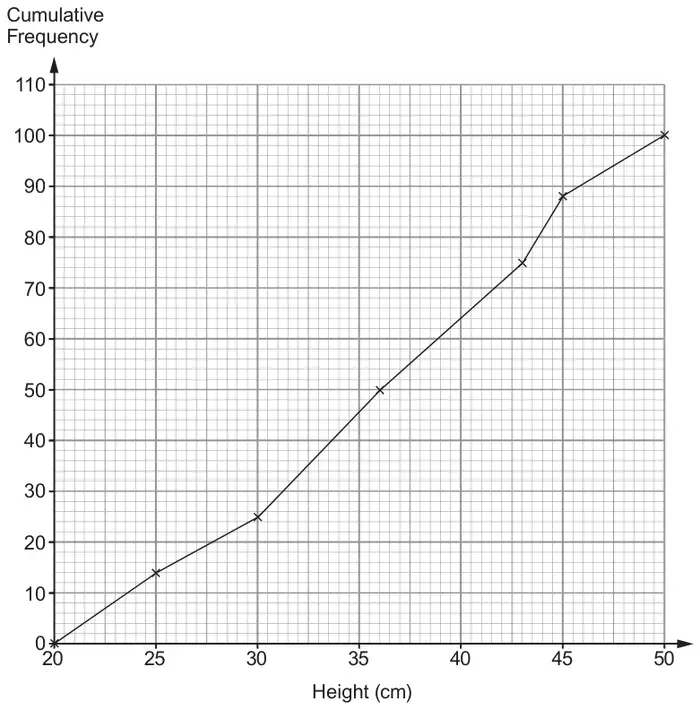
(a) The diagram shows the distribution of the heights, in cm, of 100 Firebird Marigold plants.
(i) How many of these Firebird Marigold plants had a height of less than 25 cm? [1]
(ii) Use the diagram to complete the table for these Firebird Marigold plants. [3]
Median
Lower Quartile
Upper Quartile
Inter-quartile Range
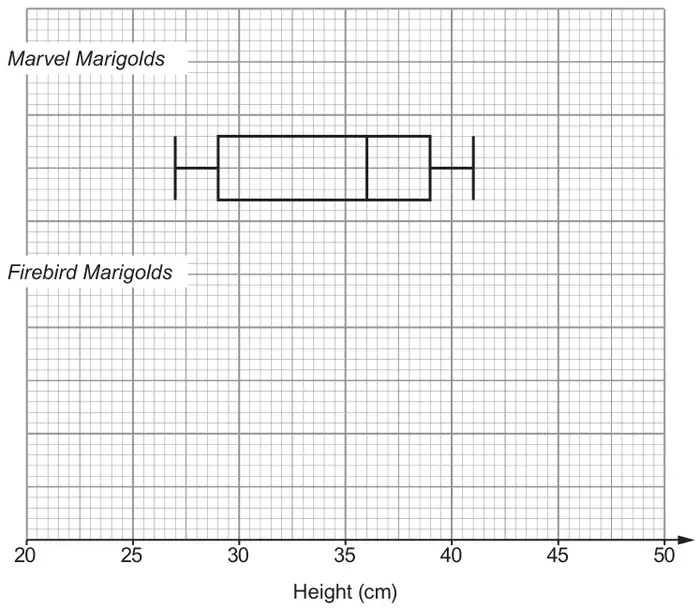
(b) This box plot shows the distribution of the heights, in cm, of 100 Marvel Marigold plants.
(i) The tallest Firebird Marigold plant had a height of 49 cm. The range of the heights of the Firebird Marigold plants was exactly 27 cm.
Use this information and the information from part (a) to draw the box plot for the Firebird Marigold plants on the grid above. [2]
(ii) Jules wants to buy one of these types of Marigold for her garden. She wants as many as possible of her plants to be at least 30 cm tall.
Should Jules buy Marvel Marigold or Firebird Marigold plants?
Marvel Marigold □ Firebird Marigold □
Give a reason for your decision. [1]
Mark scheme (a)
Scheme
Marks
Comments
(i) 14
B1
(ii)
M
LQ
UQ
IQR
36
30
43
13
B3
B1 Correct median B1 Correct LQ & UQ B1 Correct FT IQR
Mark scheme (b)
Scheme
Marks
Comments
(i) Correct box plot: Whiskers from 22 to 49 Box from 30 to 43 Median at 36
B2
FT ‘their values from (a)(ii)’ if possible
B1 for 2 out of 3 correct or correct FT from whiskers, box, median
(ii) Firebird Marigold and correct reason e.g. ‘75(%) of these plants were more than 30 cm tall whereas less than 75(%) of the Marvel ones were.’
E1
Allow e.g. ‘More of the Firebird are taller than 30 cm’ or ‘75(%) of the Firebird are taller than 30 cm’ or ‘Because the lower quartile of the Firebird marigolds is higher being equal to 30.’
Do not accept e.g. ‘More of the Firebird are taller.’ or ‘It has the closest range to 30.’ or ‘It has a higher lower quartile.’
Must not have any incorrect justification e.g. ‘More of the Firebird are taller than 30 and the interquartile range is higher.’ is E0
We'd like to use Google Analytics cookies to count visits and see which pages help most. They're optional, and the site works exactly the same either way. Privacy policy