
Higher June 2022 Paper 2 Q6
6. In an experiment, a scientist records the temperature, \(y\) °C, of an object as it is heated for \(x\) seconds.
The scientist thinks that the equation \(y = mx + c\) is a good fit for this data.
The diagram shows his results on a scatter graph and his line of best fit.
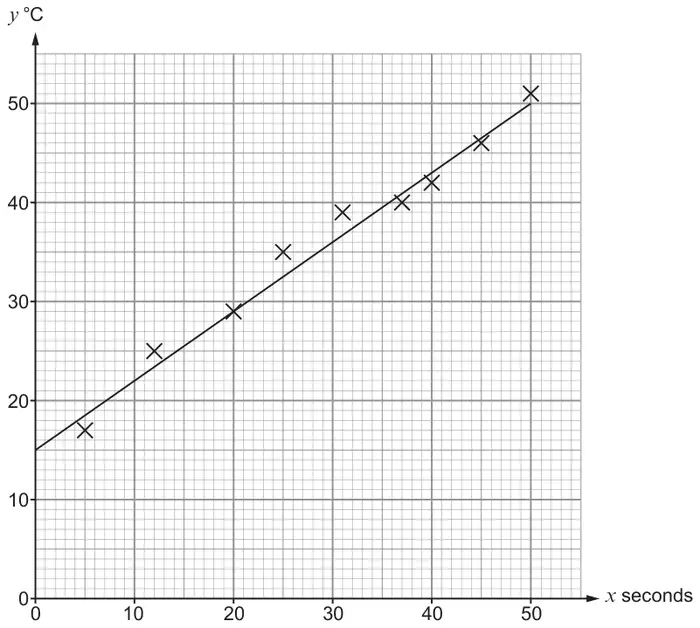
(a) Estimate the number of seconds for which the object has been heated when its temperature is 27 °C. [1]
(b)
When \(x = 70\) seconds, the scientist measures the value of \(y\) to be 52 °C.
Use this information to decide whether the line of best fit is likely or unlikely to give reliable predictions for values of \(y\) when \(x\) is greater than 50 seconds.
Likely ☐ Unlikely ☐
Explain how you decide. [1]
(c)
The line of best fit passes through the points (0, 15) and (10, 22).
Find the equation of the line of best fit.
Give your answer in the form \(y = mx + c\). [3]
(d) Explain what the gradient of the line of best fit represents in this context. [1]
| Scheme | Marks | Comments |
|---|---|---|
| 17 (seconds) | B1 | Allow answers in the range 17 to 17.4 |
| Scheme | Marks | Comments |
|---|---|---|
| ‘Unlikely’ and valid explanation e.g. ‘The line of best fit predicts 64°C at 70 seconds’ or “The temperature has stayed the same (but the line of best fit is increasing)’ or ‘The line of best fit predicts just over 50 seconds for 52°C’. 'The temperature is 50 degrees at 50 seconds (so at 70 seconds it would be a lot more)' | E1 | Ignore additional comments if correct statement seen. Allow ‘unlikely’ with explanations that imply the use of the line of best fit e.g. 'The temperature should have raised a lot more and be way past 52' 'The temperature is 51 degrees at 50 ' Do not allow e.g. ‘The data is unreliable as it only goes to 50 seconds.’ |
| Scheme | Marks | Comments |
|---|---|---|
| \(y = \dfrac{7}{10}x + 15\) oe | B3 | Must be given as an equation. If B3 not awarded award one of the following: B2 for sight of \(y = \dfrac{7}{10}x + c\) or gradient or \((m =)\ \dfrac{7}{10}\) B1 for sight of \(y = mx + 15\) or \(c = 15\) For B2 or B1, \(m\) or \(c\) in the equation could be algebraic or numeric |
| Scheme | Marks | Comments |
|---|---|---|
| Valid explanation e.g. ‘The increase in temperature per 1 second’ ‘The rate of increase in temperature’ ‘How quickly the temperature increases with time’ | E1 | Allow explanations that consider both the steepness of the line and the variables, e.g. ‘How steep the line is so as time increases so does temperature.’ ‘A change in temperature as the time goes up’. Do not allow, e.g. ‘The steepness’ ‘As time increases temperature increases’ |
| (6) |