
Foundation November 2023 Paper 1 Q19
19. 120 people each completed a puzzle.
The times taken to complete the puzzle are shown in the diagram below.
The diagram uses groups of width 5 minutes: \(0 \leqslant \text{time} \lt 5\), \(5 \leqslant \text{time} \lt 10\), and so on.
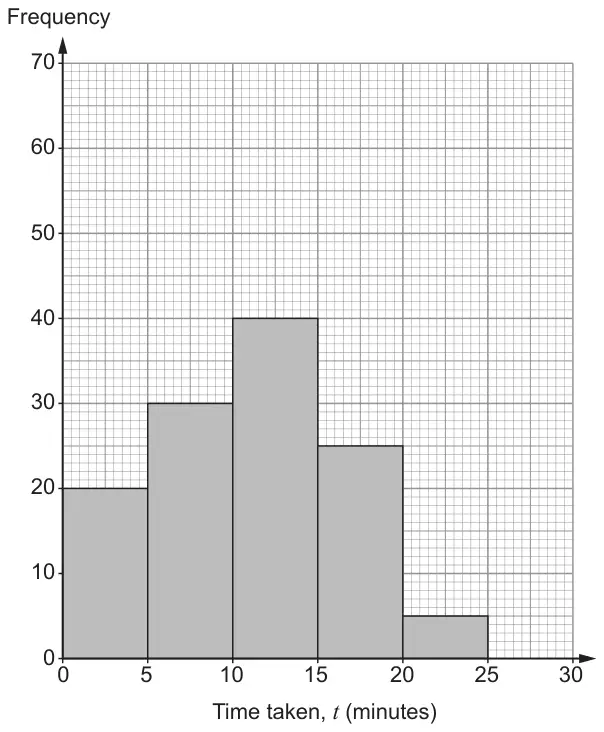
A person is chosen at random.
What is the probability that this person took less than 15 minutes to complete the puzzle? [2]
| Scheme | Marks | Comments |
|---|---|---|
| \(\frac{90}{120}\) oe ISW | B2 | May be seen on the diagram. B1 for one of the following:
|
| (2) |