
Foundation November 2021 Paper 1 Q14
14. Three workmates, Alf, Nicky and Harriet, took part in a first aid training course at the local medical centre.
The course ended at 15:30.
After the course, they all travelled home to the same village.
The distance-time graph shows Alf’s journey and Nicky’s journey.
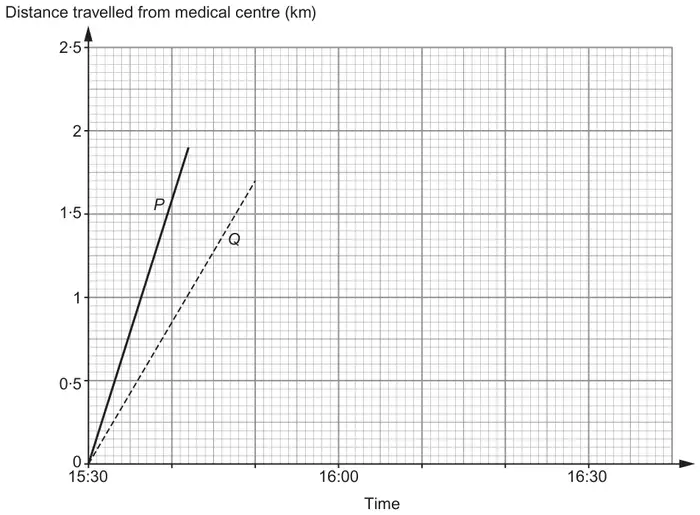
Alf rode his bicycle and Nicky walked home.
Which of the two lines on the graph, \(P\) or \(Q\), is more likely to represent Nicky’s journey home?
\(P\) ☐ \(Q\) ☐
Explain how you decide. [1]
Harriet waited 10 minutes at a bus stop outside the medical centre and then caught the bus home.
After 5 minutes, the bus stopped in a traffic jam 0·5 km from the medical centre for 12 minutes.
The bus then travelled directly to Harriet’s village.
Harriet got off the bus at a stop in her village 1·5 km from the medical centre.
Harriet was on the bus for a total of 20 minutes.
Harriet got off the bus and then walked 0·5 km to her house.
She walked at a speed of 2 km per hour.
How many minutes did it take Harriet to walk home from the bus stop? [2]
…………… minutes
Harriet lives further from the medical centre than Alf and Nicky.
Complete Harriet’s journey home on the distance-time graph. [1]
| Scheme | Marks | Comments |
|---|---|---|
| \(Q\) indicated and a valid explanation e.g. ‘Line \(Q\) is not as steep as line \(P\).’ or ‘A bike should be quicker than walking.’ | E1 | Must not contain incorrect comments but ignore irrelevant comments Allow e.g. Q indicated and ‘Nicky took longer’ Do not allow e.g. ‘Alf was on a bicycle’ only |
| Scheme | Marks | Comments |
|---|---|---|
| (i) 3 correct lines drawn: (15 40, 0) to (15 45, 0.5) (15 45, 0.5) to (15 57, 0.5) (15 57, 0.5) to (16 00, 1.5) | B3 | Accept freehand lines, dashed lines or curves joining points for full marks for part marks (speed is not necessarily constant so lines do not have to be ruled, although they may be); ignore a horizontal line from (15 30, 0) to (15 40, 0) Ends of lines must be within ½ a square radially of where they should be B1 for the line joining (15 40, 0) to (15 45, 0.5) B1FT for (‘their 15 45’, ‘their 0.5’) to (‘their 15 45’+12, ‘their 0.5’) B1FT for (‘their 15 45+12’, ‘their 0.5’) to (‘their 15 40’ + 20, 1.5) |
| (ii) 15 (minutes) | B2 | B1 for ¼ hour or clear evidence of a correct interpretation of the speed in minutes e.g. 2 km in 60 minutes or 1 km in 30 minutes |
| (iii) Correct line drawn: (16 00, 1.5) to (16 15, 2) | B1 | FT (‘their 15 40 + 20’, 1.5) to (‘their 15 40 + 20’ + ‘their 15 mins’, 2); NB not a strict FT of their (b)(ii); |
| (7) |