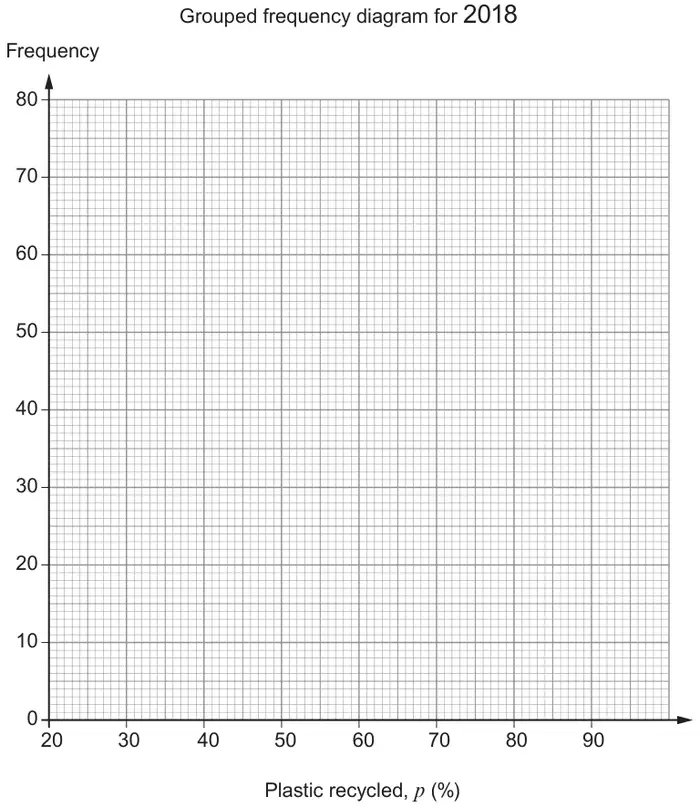
13. The grouped frequency table shows information about the percentage of plastic packaging that each of the 235 members of an eco-group recycled in 2018.
Plastic recycled, \(p\) (%)
Frequency
\(30 \leqslant p \lt 40\)
12
\(40 \leqslant p \lt 50\)
65
\(50 \leqslant p \lt 60\)
74
\(60 \leqslant p \lt 70\)
55
\(70 \leqslant p \lt 80\)
29
(a)
On the graph paper below, draw a grouped frequency diagram to show this data. [2]
(b)
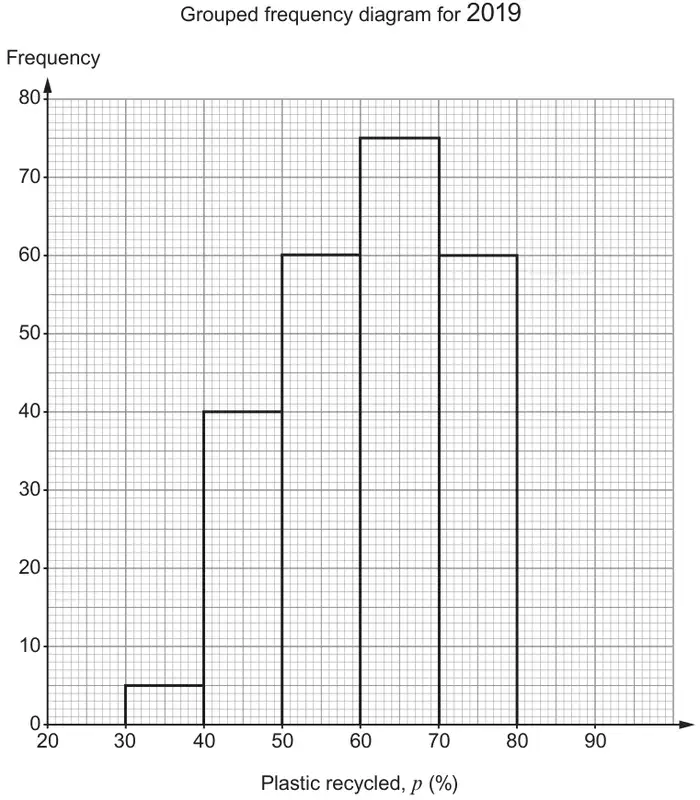
In 2019, the eco-group had more members. They recorded the percentage of plastic packaging that they each recycled for that year. The grouped frequency diagram of the results is shown below.
What is the probability that a member of the eco-group recycled at least 70% of their plastic packaging in 2019? [2]
(c) Use the information provided to write a statement comparing the percentage of plastic recycled in these two years. [1]
Mark scheme (a)
Scheme
Marks
Comments
Correct frequency diagram
B2
May be a bar chart or frequency polygon. For frequency polygon, ignore points to the left of (35, 12) and to the right of (75, 29)
B1 for a bar chart attempt, 3 or 4 bars correct; no gaps NB heights are 12, 65, 74, 55, 29
or, for a frequency polygon attempt, 3 or 4 points plotted correctly and joined; mark intent to join points NB (35, 12) (45, 65) (55, 74) (65, 55) (75, 29)
Allow good freehand
Mark scheme (b)
Scheme
Marks
Comments
\(\dfrac{60}{240}\) oe, ISW
B2
Allow e.g. \(\frac{1}{4}\), 0.25 or 25% but not 1 : 4
B1 for 5 + 40 + 60 + 75 + 60 or 240 seen or for 60 as the numerator in a fraction less than 1
Mark scheme (c)
Scheme
Marks
Comments
Correct comparison e.g. ‘In 2019 a greater percentage of plastic was recycled as there were fewer people in the 30 – 40 category in 2019 than in 2018.’
or ‘In 2019 the modal class is 60 to 70 whereas in 2018 it is only 50 to 60.’
or ‘In 2019 more people recycled more than 70% of their plastic than in 2018.’
E1
Must be a comparison Allow e.g. ‘The bars are taller to the right in 2019.’ or ‘The mode was lower in 2018.’ or ‘More people are recycling more plastic.’ or ‘More plastic is recycled in 2019’ or ‘It has increased.’ or ‘The amount recycled by the members has increased in the past year.’
Do not allow e.g. ‘It has increased as they have more members.’ or ‘The percentage of people recycling plastic has gone up.’ or ‘The amount of people recycling has increased.’ or ‘The plastic recycled goes up throughout 2019 whereas in 2018 it went up at the start of the year, then down.’
We'd like to use Google Analytics cookies to count visits and see which pages help most. They're optional, and the site works exactly the same either way. Privacy policy