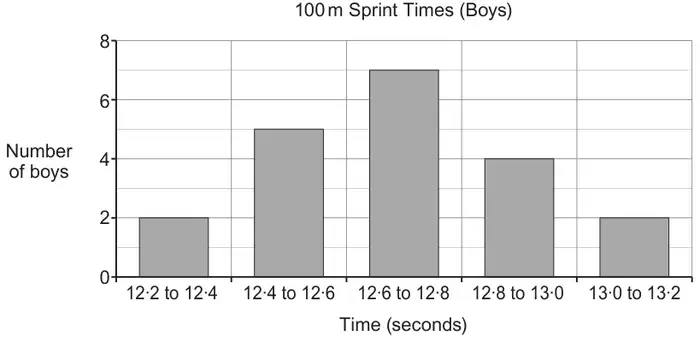
Twenty teenage boys take part in sprint races over 100 metres. One of the boys draws a graph to summarise their times.
Make one criticism of the diagram. [1]
(b)
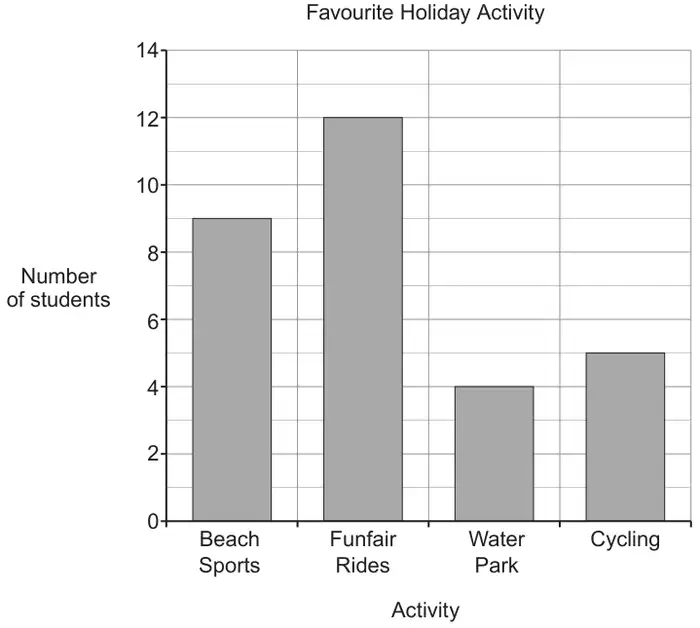
The bar chart shows the favourite holiday activity of a group of 30 students.
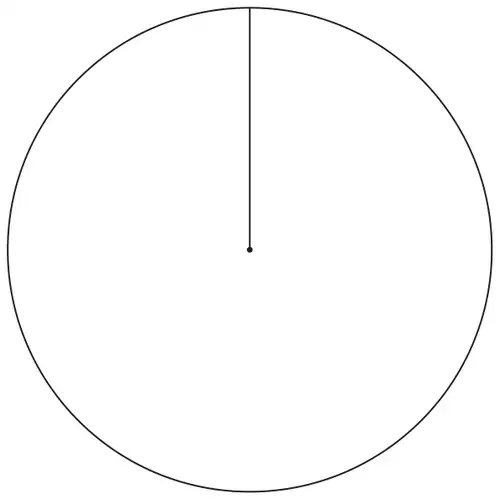
Use the bar chart to complete the pie chart opposite. You may use the table to help you. You must show all your working. [5]
Favourite Holiday Activity
Beach sports (B)
Funfair rides (F)
Water park (W)
Cycling (C)
Mark scheme (a)
Scheme
Marks
Comments
Valid criticism e.g. ‘There should be no gaps between the bars.’
E1
Allow e.g. ‘Some of the values overlap.’ or ‘There should not be gaps.’ or ‘The bars should all touch.’ or ‘The 12.4 appears on two bars.’ or ‘They have the same numbers twice.’ or ‘The bars should be together.’
Ignore irrelevant embellishments but do not allow a contradiction or an incorrect statement e.g. ‘It goes 12 to 12.4 and then 12.4 again. It should have gone on to 12.5’ is E0
Mark scheme (b)
Scheme
Marks
Comments
Question requires working to be shown
(Frequencies of) 9, 12, 4, 5 si
B1
At least 1 of 9 × (360 ÷ 30) 12 × (360 ÷ 30) 4 × (360 ÷ 30) 5 × (360 ÷ 30)
M1
FT ‘their frequencies’; allow for e.g. 9 × 12; allow for 360 ÷ 30 = 12 and sight of one correct angle e.g. 108 or sight of at least 2 correct angles
For at least 3 of (Angles) B 108, F 144, W 48, C 60
M1
Correct, labelled pie chart with no incorrect angles seen in working
A2
Allow tolerance of ±2° for all angles;
Lines must be ruled
If angles stated: measure 3 angles and if in tolerance and no incorrect angles or percentages have been stated, allow the A2
If 3 or 4 angles not stated: measure all 4 angles and if all 4 in tolerance allow the A2 otherwise award A1
A1 FT for at least 2 out of their 4 angles in tolerance; may be unlabelled
We'd like to use Google Analytics cookies to count visits and see which pages help most. They're optional, and the site works exactly the same either way. Privacy policy