
Higher June 2023 Paper 1 Q23
23.
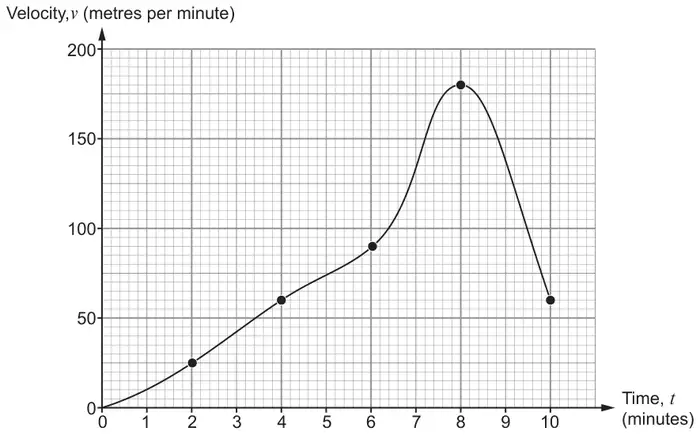
The diagram shows a velocity-time graph for the first 10 minutes of a cyclist’s journey.
The velocity is given in metres per minute and the time is given in minutes.
How many minutes after the start of the journey did the cyclist first travel at a velocity of 9 kilometres per hour? [4]
| Scheme | Marks | Comments |
|---|---|---|
| 9 | Method marks can be awarded in either order | |
| × 1000 | M1 | |
| ÷ 60 | M1 | |
| 150 (metres per minute) | A1 | CAO |
| 7.2 (minutes) | B1 | Mark final answer. FT from ‘their 150’ provided at least M1 previously awarded and their 150 > 60 |
| (4) |