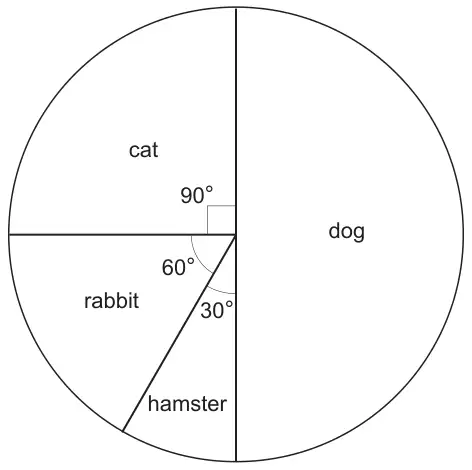
5. Each student in a group was asked to choose their favourite pet. The pie chart below shows the results.
(a) What fraction of the students chose hamster? Give your answer in its simplest form. [2]
(b)
One student is chosen at random from the group.
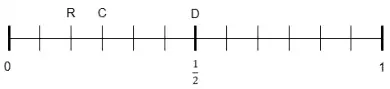
D is the probability that the student’s favourite pet is a dog C is the probability that the student’s favourite pet is a cat R is the probability that the student’s favourite pet is a rabbit.
Mark D, C and R on the probability scale below. [3]
Mark scheme (a)
Scheme
Marks
Comments
\(\dfrac{1}{12}\)
B2
B1 for \(\frac{30}{360}\) or equivalent fraction that has not been fully simplified or has been simplified incorrectly.
We'd like to use Google Analytics cookies to count visits and see which pages help most. They're optional, and the site works exactly the same either way. Privacy policy