
4400 Higher November 2005 Paper 3 Q17
17 The diagram shows part of the graph of \(y = \mathrm{f}(x)\).
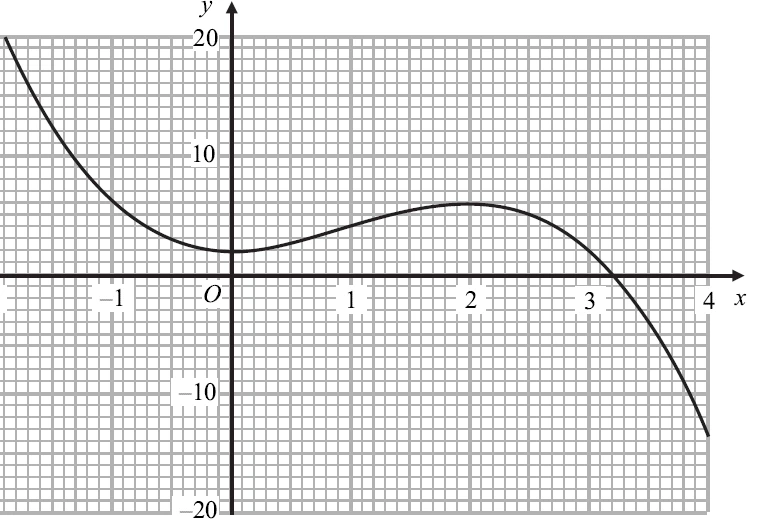
(a) Find \(\mathrm{f}(3)\). (1)
(b) Solve \(\mathrm{f}(x) = 6\) (2)
(c) Find \(\mathrm{ff}(1)\). (2)
(d) Find an estimate for the gradient of the curve at the point where \(x = -1\) (3)
The equation \(\mathrm{f}(x) = k\), where \(k\) is a number, has 3 solutions between \(x = -2\) and \(x = 4\)
(e) Complete the inequalities which \(k\) must satisfy.
.......... \(< k <\) .......... (2)
.......... \(< k <\) .......... (2)
| Scheme | Marks |
|---|---|
| 2 | B1 |
| (1) |
Notes
B1: cao
| Scheme | Marks |
|---|---|
| −1 | B1 |
| 2 | B1 |
| (2) |
Notes
B1: cao
B1: accept 1.9
| Scheme | Marks |
|---|---|
| f(4) | M1 |
| −14 | A1 |
| (2) |
Notes
A1: accept −13 to −14 inclusive
| Scheme | Marks |
|---|---|
| tangent drawn at \((-1, 6)\) | M1 |
| \(\dfrac{\text{vertical difference}}{\text{horizontal difference}}\) | M1 |
| \(\approx -9\) | A1 |
| (3) |
Notes
M1: within guidelines
M1: of points on tang or chord near \((-1, 6)\)
A1: dep on second M1
| Scheme | Marks |
|---|---|
| 2 | B1 |
| 6 | B1 |
| (2) | |
| (10 marks) |
Notes
B1: cao
B1: cao