
4400 Higher June 2007 Paper 3 Q12
12 The grouped frequency table gives information about the weights of 60 cows.
| Weight (\(w\) kg) | Frequency |
|---|---|
| \(100 \lt w \leqslant 200\) | 10 |
| \(200 \lt w \leqslant 300\) | 16 |
| \(300 \lt w \leqslant 400\) | 15 |
| \(400 \lt w \leqslant 500\) | 9 |
| \(500 \lt w \leqslant 600\) | 6 |
| \(600 \lt w \leqslant 700\) | 4 |
(a) Complete the cumulative frequency table.
(1)
| Weight (\(w\) kg) | Cumulative frequency |
|---|---|
| \(100 \lt w \leqslant 200\) | |
| \(100 \lt w \leqslant 300\) | |
| \(100 \lt w \leqslant 400\) | |
| \(100 \lt w \leqslant 500\) | |
| \(100 \lt w \leqslant 600\) | |
| \(100 \lt w \leqslant 700\) |
(b) On the grid, draw the cumulative frequency graph for your table.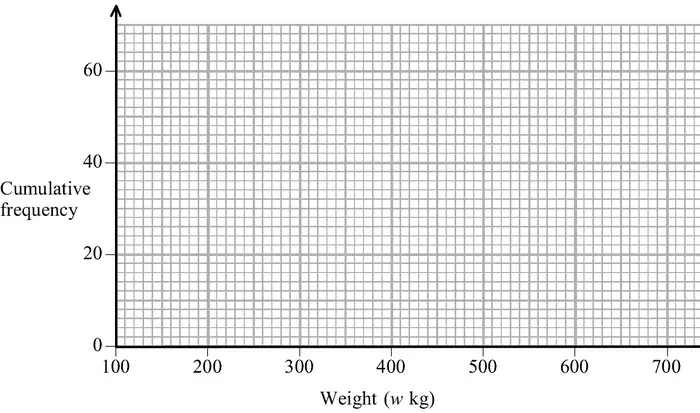
(c) Use your graph to find an estimate for the number of cows that weighed more than 430 kg.
Show your method clearly. (2)
Show your method clearly. (2)
| Scheme | Marks |
|---|---|
| 10, 26, 41, 50, 56, 60 | B1 |
| (1) |
Notes
B1: cao
| Scheme | Marks |
|---|---|
| Points correct | B1 |
| Curve or line segments | B1 |
| (2) |
Notes
B1: ± ½ sq ft from sensible table
B1: ft if 4 or 5 points correct or if points are plotted consistently within each interval (inc end points) at the correct height
| Scheme | Marks |
|---|---|
| Use of \(w = 430\) on graph | M1 |
| Approx 16 | A1 |
| (2) | |
| (5 marks) |
Notes
M1: may be shown on graph or implied by 43, 44 or 45 stated
A1: If M1 scored, ft from cumulative frequency graph
If no method shown, ft only from correct curve