
4400 Higher November 2009 Paper 3 Q16
16 The cumulative frequency diagram shows information about the heights, in centimetres, of 200 plants.
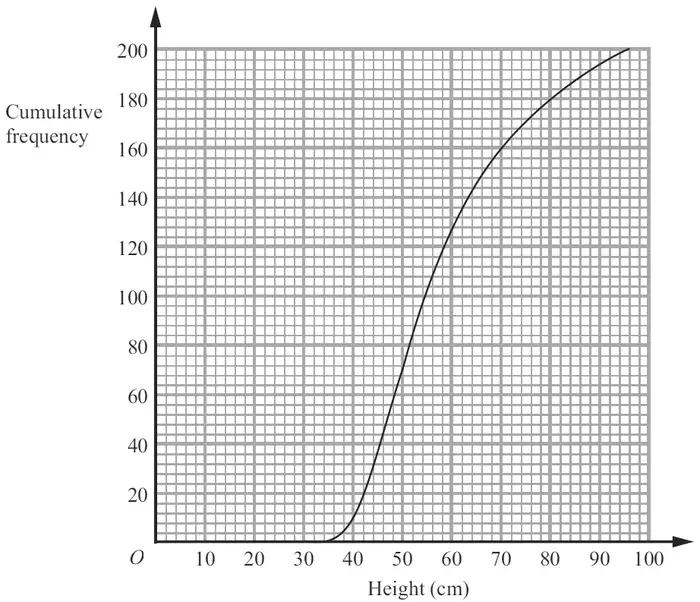
(a) Find an estimate for the median height. (2)
(b) Work out an estimate for the number of plants whose heights are greater than 80 cm. (2)
| Scheme | Marks |
|---|---|
| Read height at cf 100 or 100.5 | M1 |
| 54 to 56 inc | A1 |
| (2) |
| Scheme | Marks |
|---|---|
| 200 − (178 to 182) | M1 |
| 18 to 22 inc | A1 |
| (2) | |
| (4 marks) |