
4400 Higher June 2010 Paper 3 Q6
6 The table shows information about the volume of water, in m3, used by each of 80 families in one year.
| Volume of water (\(V\) m3) | Frequency |
|---|---|
| \(0 \lt V \leqslant 100\) | 2 |
| \(100 \lt V \leqslant 200\) | 4 |
| \(200 \lt V \leqslant 300\) | 6 |
| \(300 \lt V \leqslant 400\) | 18 |
| \(400 \lt V \leqslant 500\) | 44 |
| \(500 \lt V \leqslant 600\) | 6 |
(a) Write down the modal class. (1)
(b) Work out an estimate for the mean volume of water used by the 80 families. (4)
(c) Complete the cumulative frequency table.
(1)
| Volume of water (\(V\) m3) | Cumulative frequency |
|---|---|
| \(0 \lt V \leqslant 100\) | |
| \(0 \lt V \leqslant 200\) | |
| \(0 \lt V \leqslant 300\) | |
| \(0 \lt V \leqslant 400\) | |
| \(0 \lt V \leqslant 500\) | |
| \(0 \lt V \leqslant 600\) |
(d) On the grid, draw a cumulative frequency graph for your table.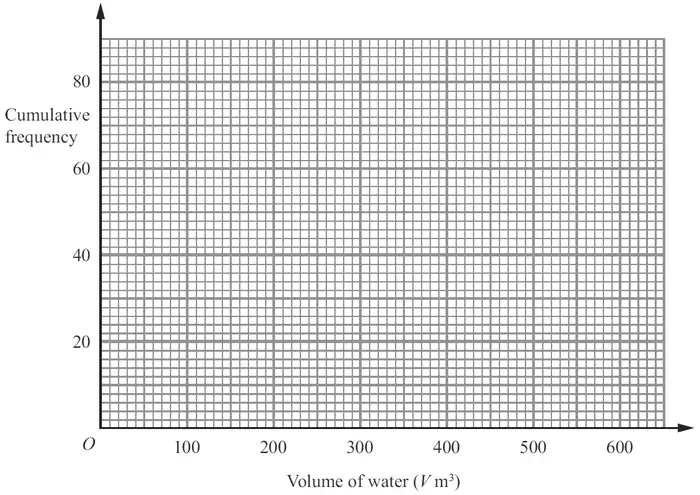
(e) Use your graph to find an estimate for the median volume of water used by the 80 families. (2)
| Scheme | Marks |
|---|---|
| \(400 \lt V \leqslant 500\) | B1 |
| (1) |
Notes
B1: Accept 400-500
| Scheme | Marks |
|---|---|
| 50 × 2 + 150 × 4 + 250 × 6 + 350 × 18 + 450 × 44 + 550 × 6 = 100 + 600 + 1500 + 6300 + 19 800 + 3300 | M1 |
| = 31 600 | M1 |
| 31 600 ÷ 80 | M1 |
| 395 | A1 |
| (4) |
Notes
M1: for finding at least 4 products \(m \times f\) consistently within intervals (inc end points)
M1: (dep) for use of at least 4 correct halfway values
M1: (dep on 1st M1) for adding and ÷ by 80
| Scheme | Marks |
|---|---|
| 2 6 12 30 74 80 | B1 |
| (1) |
Notes
B1: cao
| Scheme | Marks |
|---|---|
| Points correct | B1 |
| Curve or line segments | B1 |
| (2) |
Notes
B1: ± ½ sq ft from sensible table
B1: ft from points if 4 or 5 correct or if points are plotted consistently within each interval at the correct heights
| Scheme | Marks |
|---|---|
| Use of 40 (or 40.5) on graph or 40 (or 40.5) stated | M1 |
| approx 420 | A1 |
| (2) | |
| (10 marks) |
Notes
M1: for use of 40 (or 40.5) on cf graph or for 40 (or 40.5) stated
A1: If M1 scored, ft from cf graph
If no indication of method, ft only from correct curve & if answer is correct (± ½ sq tolerance) award M1 A1