
4MA0 Foundation June 2011 Paper 2 Q11
11 Some people took a driving test.
The pie chart shows information about their results.
The pie chart is accurately drawn.
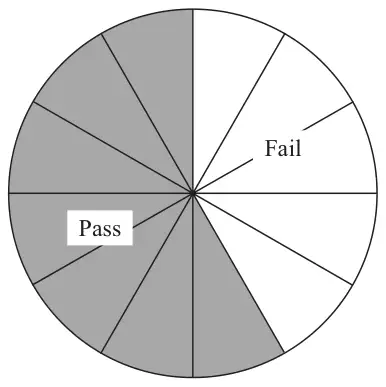
20 drivers failed the test.
How many drivers passed the test?
(2)
| Scheme | Marks |
|---|---|
| 20 ÷ 5 × 7 oe | M1 |
| 28 | A1 |
| (2) | |
| (Total 2 marks) |
Notes
M1: accept 4 × 7 or 140 ÷ 5