
4MA0 Foundation January 2012 Paper 1 Q11
11 First year students at a college chose their favourite type of music.
The pie chart shows information about their choices.
The pie chart is accurately drawn.
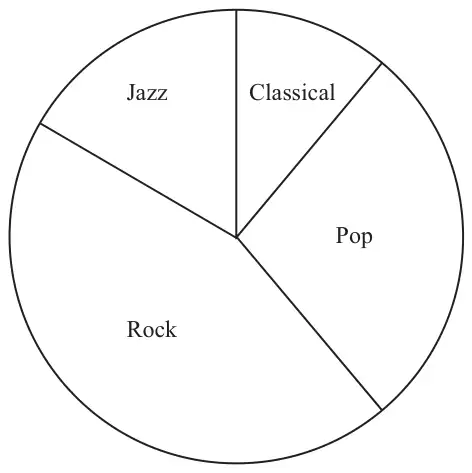
(a) 18 students chose Classical.
Work out the number of students who chose Jazz. (3)
Work out the number of students who chose Jazz. (3)
(b) Another pie chart is to be drawn for second year students.
There are 150 second year students.
60 of these students chose Rock.
Calculate the angle in the pie chart for these 60 second year students who chose Rock. (2)
There are 150 second year students.
60 of these students chose Rock.
Calculate the angle in the pie chart for these 60 second year students who chose Rock. (2)
| Scheme | Marks |
|---|---|
| “60”/“40” or “40”/“60” | M1 |
| 18 × “60”/“40” oe | M1 |
| 27 | A1 |
| (3) |
Notes
M1: (angles ±2°)
A1: accept answers which round to 29 to 25 if evidence of angles measured.
| Scheme | Marks |
|---|---|
| \(\dfrac{60}{150} \times 360\) | M1 |
| 144 | A1 |
| (2) | |
| (Total 5 marks) |
Notes
M1: M1 for \(\dfrac{60}{150}\) (=0.4) or \(\dfrac{150}{60}\) (=2.5)