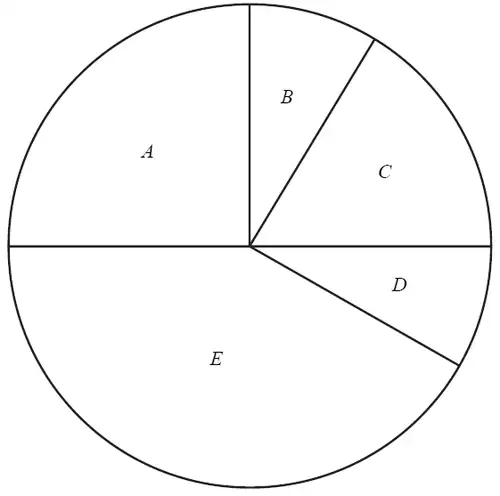
(a) The pie chart shows information about the number of students in each class. The pie chart is accurately drawn.A student from the school is chosen at random. Find the probability that this student is in class \(E\). (2)
(b) The table shows information about the ages of the students.
Age, \(x\) years
Frequency
\(9 \leqslant x \lt 11\)
30
\(11 \leqslant x \lt 13\)
12
\(13 \leqslant x \lt 15\)
18
\(15 \leqslant x \lt 19\)
60
Calculate an estimate of the mean age of these students. Give your answer correct to 3 significant figures. (4)