
4MA0 Foundation January 2012 Paper 2 Q1
1 The bar chart shows information about the number of visitors to each of five London tourist attractions in 2008.
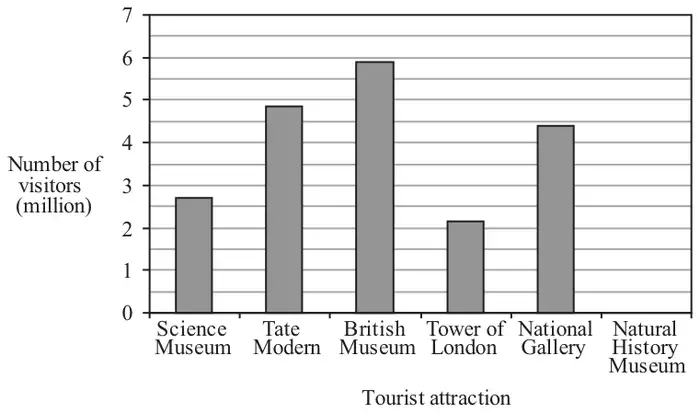
The British Museum had 5.9 million visitors.
(a) Write down the number of visitors to the Science Museum. (1)
(b) Which tourist attraction had 4.4 million visitors? (1)
(c) In 2008, the Natural History Museum had 3.7 million visitors.
Draw a bar on the bar chart to show this information. (1)
Draw a bar on the bar chart to show this information. (1)
(d) The number of visitors to one of these tourist attractions was equal to the sum of the number of visitors to the Science Museum and the number of visitors to the Tower of London.
Which tourist attraction was this? (1)
Which tourist attraction was this? (1)
| Scheme | Marks |
|---|---|
| 2.5 < ans < 3 | B1 |
| (1) |
| Scheme | Marks |
|---|---|
| National Gallery | B1 |
| (1) |
| Scheme | Marks |
|---|---|
| 3.5 < bar < 4 | B1 |
| (1) |
| Scheme | Marks |
|---|---|
| Tate Modern | B1 |
| (1) | |
| (Total 4 marks) |