
4MA0 Foundation June 2011 Paper 1 Q2
2 The bar chart shows information about the number of silver medals won by each of 5 countries at the 2008 Olympic Games.
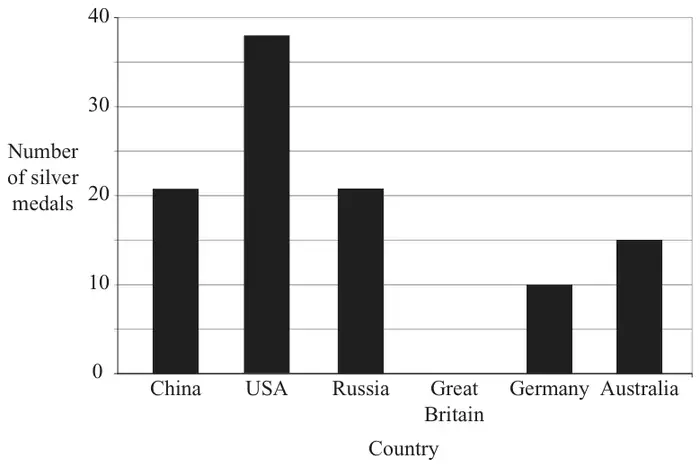
(a) Which two of the countries won an equal number of silver medals? (1)
(b) How many silver medals did the USA win? (1)
(c) Great Britain won 13 silver medals.
Draw a bar on the bar chart to show this information. (1)
Draw a bar on the bar chart to show this information. (1)
(d) Find the ratio of the number of silver medals won by Germany to the number of silver medals won by Australia.
Give your ratio in its simplest form. (2)
Give your ratio in its simplest form. (2)
| Scheme | Marks |
|---|---|
| China Russia | B1 |
| (1) |
Notes
B1: Condone spelling errors
| Scheme | Marks |
|---|---|
| 38 | B1 |
| (1) |
Notes
B1: Accept 35 < ans < 40 even if non-integer
| Scheme | Marks |
|---|---|
| 10 < bar < 15 | B1 |
| (1) |
| Scheme | Marks |
|---|---|
| 10 : 15 | M1 |
| 2 : 3 | A1 |
| (2) | |
| (Total 5 marks) |
Notes
A1: SC if M0, award M1 for 3 : 2 or 1 : 1.5