
4MA0 Foundation January 2012 Paper 1 Q5
5 The pictogram shows information about the numbers of ice creams sold by a shop on five days.
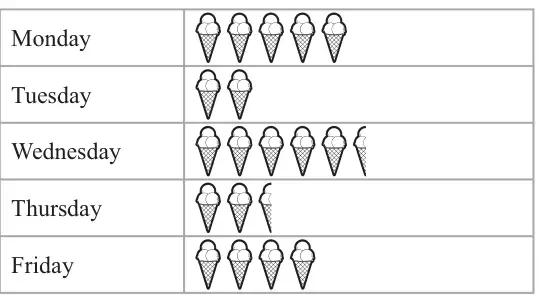
(a) On which day did the shop sell the greatest number of ice creams? (1)
The shop sold 20 ice creams on Tuesday.
(b)
(i) How many ice creams sold does  represent?
represent?(ii) Find the number of ice creams sold on Friday.
(iii) Find the number of ice creams sold on Thursday.
(3)12% of the ice creams sold by the shop were strawberry.
(c)
(i) Write 12% as a decimal.
(ii) Write 12% as a fraction.
Give your fraction in its simplest form.
(3)Give your fraction in its simplest form.
On Saturday, the shop sold 15 chocolate ice creams and 35 vanilla ice creams.
(d) Write down the ratio of the number of chocolate ice creams sold to the number of vanilla ice creams sold.
Give your answer in its simplest form. (2)
Give your answer in its simplest form. (2)
| Scheme | Marks |
|---|---|
| Wednesday | B1 |
| (1) |
Notes
B1: (any recognisable spelling or abbreviation)
| Scheme | Marks |
|---|---|
| (i) Answer: 10 | B1 |
| (ii) Answer: 40 | B1 |
| (iii) Answer: 25 | B1 |
| (3) |
Notes
B1: ft from (i) {i.e. 4 × ans to (b)(i)}
B1: ft from (i) {i.e. 2.5 × ans to (b)(i)}
| Scheme | Marks |
|---|---|
| (i) Answer: 0.12 | B1 |
| (ii) \(\dfrac{12}{100}\) | M1 |
| \(\dfrac{3}{25}\) | A1 |
| (3) |
Notes
B1: cao
M1: accept \(\dfrac{6}{50}\)
| Scheme | Marks |
|---|---|
| 15 : 35 | M1 |
| 3 : 7 | A1 |
| (2) | |
| (Total 9 marks) |
Notes
A1: cao SC B1 for 7 : 3 or 1 : 2.33.. {at least 2 d.p}