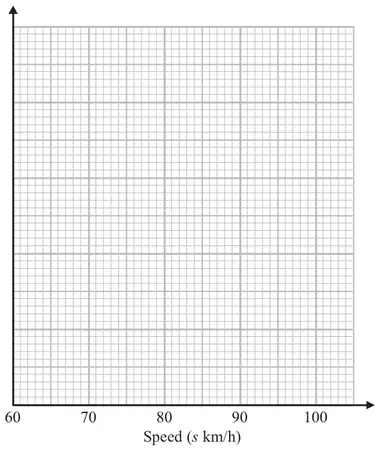
22 The table gives some information about the speeds, in km/h, of 100 cars.
Speed (\(s\) km/h)
Frequency
\(60 \lt s \leqslant 65\)
15
\(65 \lt s \leqslant 70\)
25
\(70 \lt s \leqslant 80\)
36
\(80 \lt s \leqslant 100\)
24
(a) On the grid, draw a histogram for the information in the table.(3)
(b) Work out an estimate for the number of cars with a speed of more than 85 km/h. (2)
Mark scheme (a)
Working
Answer
Mark
Notes
F
15
25
36
24
Fd
3
5
3.6
1.2
Correct histogram
3
B3 for fully correct histogram (overlay) (B2 for 3 correct blocks) (B1 for 2 correct blocks of different widths) SC : B1 for correct key, eg. 1 cm2 = 5 (cars) or correct values for (freq ÷ class interval) for at least 3 frequencies (3, 5, 3.6, 1.2) NB: The overlay shows one possible histogram, there are other correct solutions.
Mark scheme (b)
Working
Answer
Mark
Notes
\(\frac{3}{4} \times 24\)
18
2
M1 for \(\frac{3}{4} \times 24\) (=18) oe or \(\frac{1}{4} \times 24\) (=6) oe A1 cao OR M1 ft histogram for 15 × “1.2” or 5 × “1.2” A1 ft