
1MA0 Higher November 2013 Paper 2 Q27
27 The histogram shows information about the times, in minutes, that some passengers had to wait at an airport.
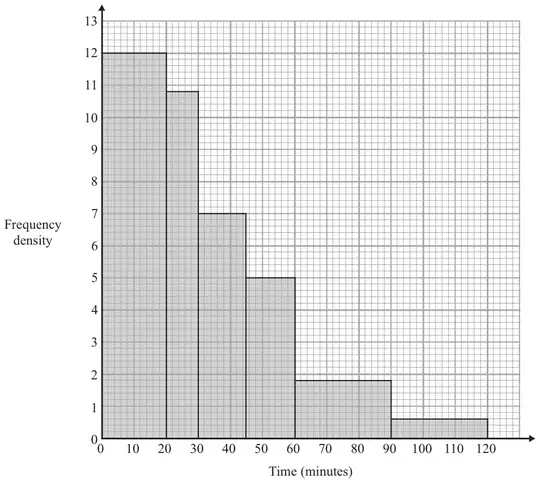
Work out the percentage of the passengers who had to wait for more than one hour. (3)
| Working | Answer | Mark | Notes |
|---|---|---|---|
| \(12 \times 20 + 10.8 \times 10 + 7 \times 15 + 5 \times 15 + 1.8 \times 30 + 0.6 \times 30\) \(= 240 + 108 + 105 + 75 + 54 + 18\) \(= 528 + 72 = 600\) | 12% | 3 | M1 for attempt to work out total area (eg =600) or area greater than 60 (eg =72) by using fd or counting squares M1 (dep) for \(\dfrac{\text{‘}72\text{’}}{\text{‘}600\text{’}} \times 100\) oe (=12) A1 cao (must have % otherwise 2 marks) |