
1MA0 Higher June 2014 Paper 2 Q2
2 The table shows the average temperature on each of seven days and the number of units of gas used to heat a house on these days.
| Average temperature (°C) | 0 | 1 | 3 | 9 | 10 | 12 | 13 |
|---|---|---|---|---|---|---|---|
| Units of gas used | 20 | 16 | 18 | 10 | 6 | 6 | 2 |
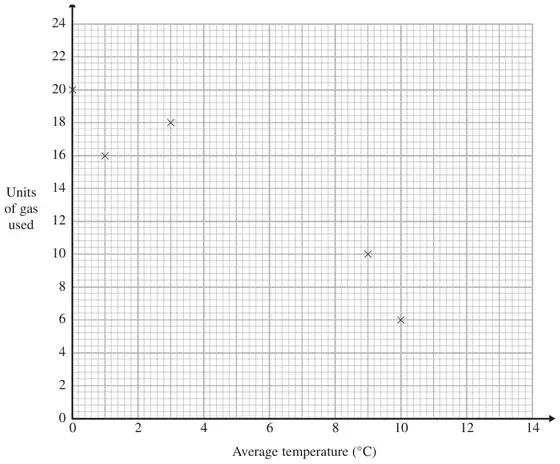
(a) Complete the scatter graph to show the information in the table.
The first 5 points have been plotted for you. (1)
The first 5 points have been plotted for you. (1)
(b) Describe the relationship between the average temperature and the number of units of gas used. (1)
(c) Estimate the average temperature on a day when 12 units of gas are used. (2)
| Answer | Mark | Notes |
|---|---|---|
| Points plotted | 1 | B1 for points plotted at (12, 6) and (13, 2) |
| Answer | Mark | Notes |
|---|---|---|
| Description | 1 | B1 for description; accept negative correlation. |
| Answer | Mark | Notes |
|---|---|---|
| 5 – 7 | 2 | M1 for evidence of use of graph eg a single straight line segment with negative gradient that could be used as a line of best fit or an indication on the diagram from 12 on the \(y\) axis. A1 for 5 – 7 |