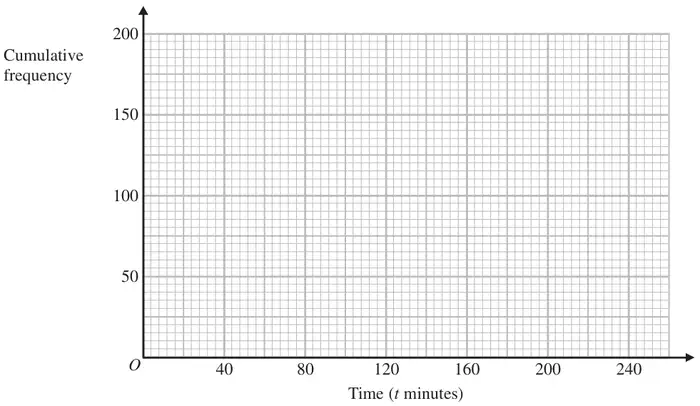
10 The grouped frequency table gives information about the lengths of time 160 students exercised one day.
Time (\(t\) minutes)
Frequency
\(0 \lt t \leqslant 40\)
20
\(40 \lt t \leqslant 80\)
35
\(80 \lt t \leqslant 120\)
60
\(120 \lt t \leqslant 160\)
33
\(160 \lt t \leqslant 200\)
7
\(200 \lt t \leqslant 240\)
5
(a) Complete the cumulative frequency table.
Time (\(t\) minutes)
Cumulative frequency
\(0 \lt t \leqslant 40\)
\(0 \lt t \leqslant 80\)
\(0 \lt t \leqslant 120\)
\(0 \lt t \leqslant 160\)
\(0 \lt t \leqslant 200\)
\(0 \lt t \leqslant 240\)
(1)
(b) On the grid, draw a cumulative frequency graph for your table.(2)
(c) Use your graph to find an estimate for the lower quartile of the lengths of time the 160 students exercised. (2)
Mark scheme (a)
Scheme
Marks
20 55 115 148 155 160
B1
(1)
Mark scheme (b)
Scheme
Marks
Points correct
B1
Curve or line segments
B1
(2)
Notes
B1: ± ½ sq
B1: ft from points if 4 or 5 correct or if points are plotted consistently within each interval at the correct heights Accept curve which is not joined to the origin
Mark scheme (c)
Scheme
Marks
40 or \(40\frac{1}{4}\) indicated on cumulative frequency axis or stated
M1
approx 63
A1
(2)
(5 marks)
Notes
M1: for 40 or \(40\frac{1}{4}\) indicated on cumulative frequency axis or stated
A1: If M1 scored, ft from cf graph If M1 not scored, ft only from correct curve and, if answer is correct (± ½ sq tolerance) award M1 A1