
4MA0 Higher June 2014 Paper 3 Q11
11 The table gives information about the speed, in km/h, of 180 vehicles passing a speed checkpoint.
| Speed (\(v\) km/h) | Frequency |
|---|---|
| \(40 \lt v \leqslant 50\) | 4 |
| \(50 \lt v \leqslant 60\) | 52 |
| \(60 \lt v \leqslant 70\) | 60 |
| \(70 \lt v \leqslant 80\) | 34 |
| \(80 \lt v \leqslant 90\) | 18 |
| \(90 \lt v \leqslant 100\) | 12 |
| Speed (\(v\) km/h) | Cumulative frequency |
|---|---|
| \(40 \lt v \leqslant 50\) | |
| \(40 \lt v \leqslant 60\) | |
| \(40 \lt v \leqslant 70\) | |
| \(40 \lt v \leqslant 80\) | |
| \(40 \lt v \leqslant 90\) | |
| \(40 \lt v \leqslant 100\) |
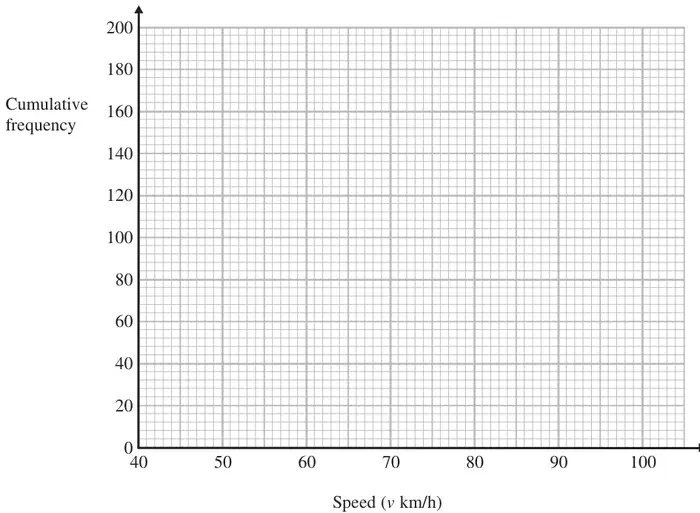
Use your graph to find an estimate for the number of drivers the police decide to fine.
Show your method clearly. (2)
| Scheme | Marks |
|---|---|
| \(60 \lt v \leqslant 70\) | B1 |
| (1) |
Notes
B1: Accept 60 – 70 or 60 to 70 or 60 → 70
| Scheme | Marks |
|---|---|
| M1 | |
| \(\dfrac{56}{180}\) oe | A1 |
| (2) |
Notes
A1: Accept answer written as an equivalent fraction, (eg \(\frac{14}{45}\)), or 0.311... (accept if first 3 SF correct) or 31.1...% (accept if first 3 SF correct)
M1A0 for 56 : 180 or 14 : 45 oe
| Scheme | Marks |
|---|---|
| 4, 56, 116, 150, 168, 180 | B1 |
| (1) |
| Scheme | Marks |
|---|---|
| All 6 plotted correctly Answer: points plotted | B1 |
| Curve or line segments | B1 |
| (2) |
Notes
B1: All 6 points plotted correctly \(\pm\frac{1}{2}\) sq
B1: ft curve/line segments from points if 4 or 5 plotted correctly or if all 6 points are plotted consistently within each interval of the frequency table at the correct heights (\(\pm\frac{1}{2}\) sq).
Accept curve which is not joined to (40 , 0)
| Scheme | Marks |
|---|---|
| vertical line or mark drawn at 84 km/or horizontal line corresponding to speed = 84km (± ½ sq) on cf graph. | M1 |
| 20 – 26 inclusive | A1 |
| (2) | |
| (8 marks) |
Notes
M1: for 84 indicated on cf graph
A1: If M1 scored from 84 indicated on graph, ft from cf graph.
If M1 not scored from 84 indicated on graph, ft only from a correct curve / line segments. If their answer comes from their curve (± ½ sq) then award M1A1.