
4MA0 Higher January 2015 Paper 3 Q13
13 The cumulative frequency graph gives information about the intelligence quotients (IQ) of a random sample of 100 adults.
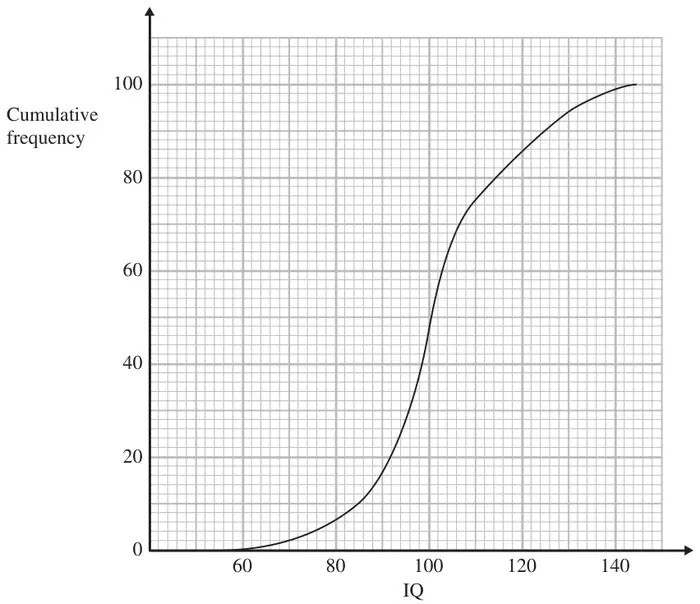
(a) Use the cumulative frequency graph to find an estimate for the number of adults in the sample who have an IQ between 85 and 115 (2)
(b) Find an estimate for the upper quartile of the IQ of adults in the sample. (2)
| Scheme | Marks |
|---|---|
| Eg 80 – 10 | M1 |
| 69 – 73 | A1 |
| (2) |
Notes
M1: for two CF values obtained using IQ values of 85 and 115 (± \(\tfrac{1}{2}\) square)
A1: Accept answer in range 69 – 73 unless clearly obtained by incorrect working
| Scheme | Marks |
|---|---|
| CF = 75 | M1 |
| 108 – 112 | A1 |
| (2) | |
| (4 marks) |
Notes
M1: for CF value of 75 or 75.75 stated or marked on the graph.
A1: Accept answer in range 108 – 112 unless clearly obtained by incorrect working