
4MA0 Foundation January 2018 Paper 1 Q3
3 The bar chart shows information about the distance travelled to school by each of five teachers.
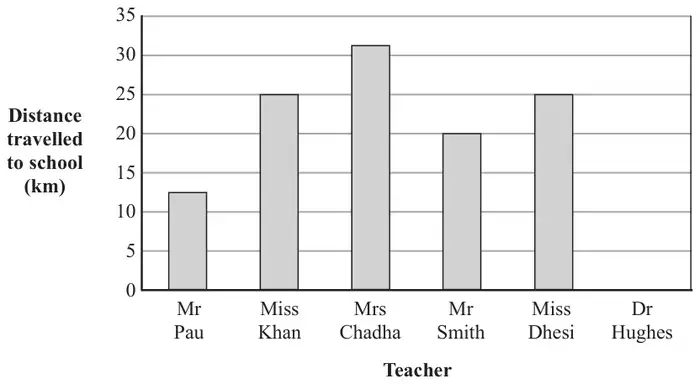
Two of the teachers travelled the same distance to school.
(a) Which two teachers? (1)
Dr Hughes travelled 28 km to school.
(b) Draw a bar on the bar chart for this information. (1)
(c) Write down the name of the teacher who travelled the greatest distance to school. (1)
| Scheme | Marks |
|---|---|
| Miss Khan & Miss Dhesi | B1 |
| (1) |
| Scheme | Marks |
|---|---|
| Correct bar | B1 |
| (1) |
Notes
B1: Bar drawn greater than 27.5 and smaller than 30 N.B. shading not needed
| Scheme | Marks |
|---|---|
| Mrs Chadha | B1 |
| (1) |