
4MA0 Foundation January 2018 Paper 1R Q7
7 The bar chart shows information about the area of land used for farming in each of four countries in 2012
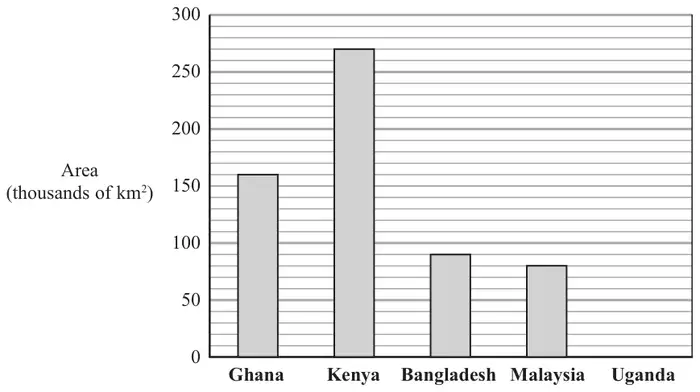
(a) Write down the area of land used for farming in Ghana in 2012 (1)
The area of land used for farming in Kenya in 2012 was greater than the area of land used for farming in Malaysia in 2012
(b) How much greater? (2)
The area of land used for farming in Uganda in 2012 was 140 thousands of km²
(c) Draw a bar on the bar chart to show this information. (1)
Coffee is grown on 7% of the land used for farming in Uganda.
(d) Work out 7% of 140 000 (2)
| Scheme | Marks |
|---|---|
| 160 | B1 |
| (1) |
Notes
B1: (accept 160 000)
| Scheme | Marks |
|---|---|
| 270 000 − 80 000 | M1 |
| 190 | A1 |
| (2) |
Notes
M1: subtract two areas (at least one correct), allowing suppression of 000s
A1: (accept 190 000)
| Scheme | Marks |
|---|---|
| Correct bar | B1 |
| (1) |
| Scheme | Marks |
|---|---|
| \(140000 \times \dfrac{7}{100}\) | M1 |
| 9800 | A1 |
| (2) |