
4MA0 Foundation January 2018 Paper 2 Q2
2 The pictogram shows information about the number of televisions sold from a shop on each of five days.
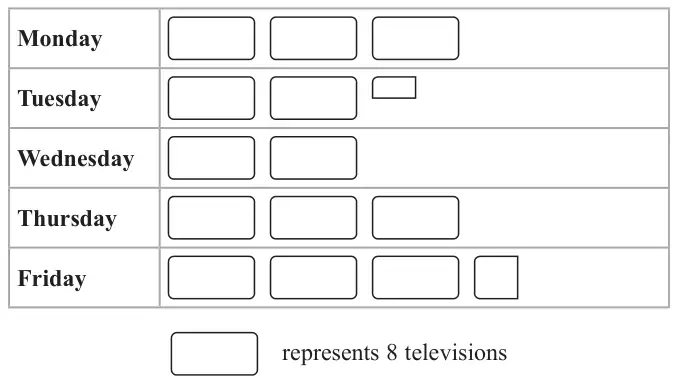
(a) How many televisions were sold on Monday? (1)
More televisions were sold on Friday than were sold on Tuesday.
(b) How many more? (2)
On Saturday, the shop had a sale.
The prices of all televisions were reduced by \(\dfrac{1}{3}\)
Before the sale, the price of a television was £549
(c) What was the sale price of this television? (3)
| Scheme | Marks |
|---|---|
| 24 | B1 |
| (1) |
| Scheme | Marks |
|---|---|
| 28 − 18 or 1.25 × 8 oe | M1 |
| 10 | A1 |
| (2) |
| Scheme | Marks |
|---|---|
| \(549 \div 3\) or \(\dfrac{1}{3} \times 549\;(= 183)\) | M1 |
| 549 − “183” or 2 × “183” | M1 |
| 366 | A1 |
| (3) |
Notes
M1: or M1 for \(1 - \dfrac{1}{3}\left(= \dfrac{2}{3}\right)\)
M1: or M1 dep for \(\text{“}\tfrac{2}{3}\text{”} \times 549\) oe