M1 for \(fx\) consistently within interval including ends (allow 1 error) M1 consistently using appropriate midpoints M1 (dep on first M1) for \(\Sigma fx \div \Sigma f\) A1 for 18.2 cao
Mark scheme (b)
Working
Answer
Mark
Notes
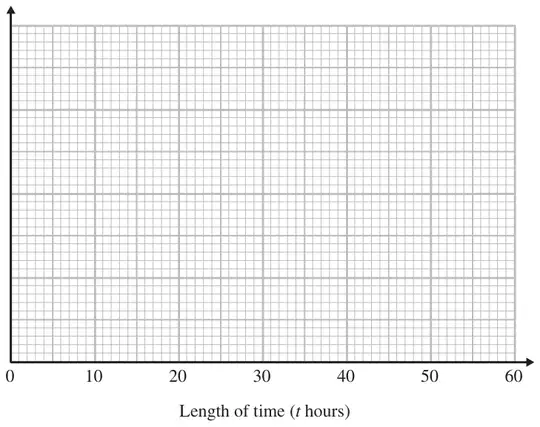
\(0 \leqslant t \lt 10\) fd 0.8 \(10 \leqslant t \lt 15\) fd 3 \(15 \leqslant t \lt 20\) fd 2.2 \(20 \leqslant t \lt 30\) fd 1 \(30 \leqslant t \lt 50\) fd 0.3
Correct histogram
3
B3 fully correct histogram with vertical axis correctly scaled. (B2 for 4 correct blocks or 5 correct blocks with incorrect or no scale) (B1 for 2 correct blocks of different widths or any 3 correct blocks or correct FD values for at least 3 frequencies) eg fd of 0.8, 3, 2.2, 1, 0.3