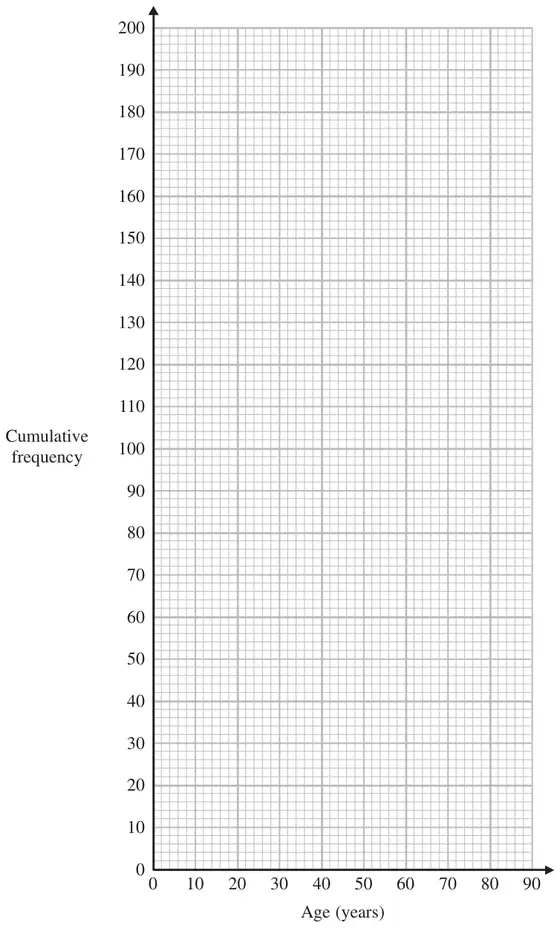
16 There are 200 workers at a factory. The cumulative frequency table gives information about their ages.
Age (\(a\) years)
Cumulative frequency
\(0 \lt a \leqslant 20\)
25
\(0 \lt a \leqslant 30\)
70
\(0 \lt a \leqslant 40\)
138
\(0 \lt a \leqslant 50\)
175
\(0 \lt a \leqslant 60\)
186
\(0 \lt a \leqslant 70\)
194
\(0 \lt a \leqslant 80\)
200
(a) On the grid, draw a cumulative frequency graph for this information.(2)
(b) Graham says, “10% of workers at the factory are older than 65” Is Graham correct? You must show how you get your answer. (2)
Mark scheme (a)
Answer
Mark
Notes
correct graph
2
M1 for 5 or 6 or 7 points plotted correctly at the ends of the intervals (overlay) A1 cao for correct graph with points joined by curve or straight line segments [SC: B1 if the shape of the graph is correct and 5 or 6 or 7 of their points are not at the ends but are plotted consistently within (10,20) (20,30) (30,40) etc.]
Mark scheme (b)
Answer
Mark
Notes
No with supporting figures
2
M1 for \(0.1 \times 200\) (=20) or \(0.9 \times 200\) (=180) or sight of 180 used on cf axis or \(200 - 186\) (=14) A1 ft for correct decision with 20 and “9” or 20 and 14 or “age” from reading graph at 180
OR M1 for method to find percentage of workers who are over 65, eg \(\dfrac{200 - \text{``}191\text{''}}{200} \times 100\) (=4.5%) or method to find percentage of workers who are over 60 (from table), eg \(\dfrac{200 - 186}{200} \times 100\) (=7%) or \(\dfrac{200 - 190}{200} \times 100\) (=5%) A1 ft for correct decision with “4.5”% or 7% or 5%