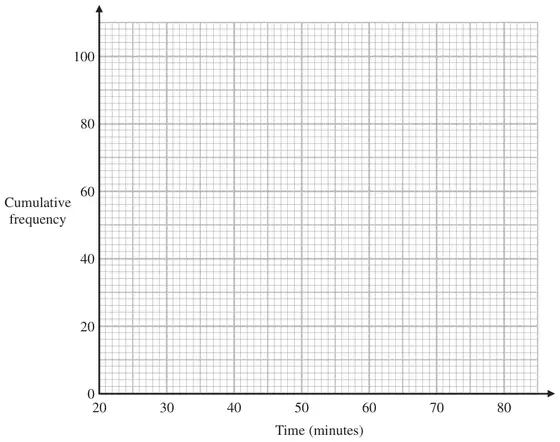
16 The table shows information about the times taken by 100 people in a fun run.
Time (\(t\) minutes)
Frequency
\(20 \lt t \leqslant 30\)
4
\(30 \lt t \leqslant 40\)
16
\(40 \lt t \leqslant 50\)
36
\(50 \lt t \leqslant 60\)
24
\(60 \lt t \leqslant 70\)
14
\(70 \lt t \leqslant 80\)
6
(a) Complete the cumulative frequency table for this information.
Time (\(t\) minutes)
Cumulative frequency
\(20 \lt t \leqslant 30\)
\(20 \lt t \leqslant 40\)
\(20 \lt t \leqslant 50\)
\(20 \lt t \leqslant 60\)
\(20 \lt t \leqslant 70\)
\(20 \lt t \leqslant 80\)
(1)
(b) On the grid, draw a cumulative frequency graph for your table.(2)
(c) Use your graph to find an estimate for the median time. (1)
(d) Use your graph to find an estimate for the number of people who took longer than 63 minutes. (2)
Mark scheme (a)
Answer
Mark
Notes
4, 20, 56, 80, 94, 100
1
B1 cao
Mark scheme (b)
Answer
Mark
Notes
graph
2
M1 ft from their table for at least 5 points plotted correctly at the ends of the intervals provided table values are cumulative, condoning one arithmetic error, or if the shape of the graph is correct for 5 or 6 points plotted not at the ends but consistently within each interval and joined A1 cao for correct graph with points joined by curve or straight line segments
Mark scheme (c)
Answer
Mark
Notes
47 to 49
1
B1 for 47 to 49 or ft their cf graph at cf = 50
Mark scheme (d)
Answer
Mark
Notes
13 to 16
2
M1 for reading a value from their cf graph at time = 63 (84 to 87) A1 for answer in the range 13 to 16 or ft from their graph