
1MA0 Higher June 2016 Paper 2 Q23
23 The table gives information about the lengths of time some people were in a supermarket.
| Time (\(t\) minutes) | Frequency |
|---|---|
| \(0 \lt t \leqslant 5\) | 8 |
| \(5 \lt t \leqslant 15\) | 32 |
| \(15 \lt t \leqslant 30\) | 36 |
| \(30 \lt t \leqslant 40\) | 18 |
| \(40 \lt t \leqslant 60\) | 6 |
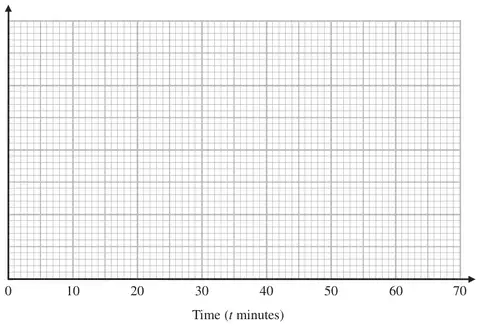
Draw a histogram for the information in the table. (3)
| Working | Answer | Mark | Notes |
|---|---|---|---|
| \(0 \lt t \leqslant 5\) fd = 8 ÷ 5 = 1.6 \(5 \lt t \leqslant 15\) fd = 32 ÷ 10 = 3.2 \(15 \lt t \leqslant 30\) fd = 36 ÷ 15 = 2.4 \(30 \lt t \leqslant 40\) fd = 18 ÷ 10 = 1.8 \(40 \lt t \leqslant 60\) fd = 6 ÷ 20 = 0.3 | Correct histogram | 3 | B3 for a fully correct histogram with vertical axis correctly scaled or with a key, eg. 2 cm² = 1 (B2 for at least 4 correct blocks with or without a scale or a key OR for all five fd correct) (B1 for 2 correct blocks of different widths or for at least three correct fd values) |