
1MA0 Higher June 2016 Paper 1 Q15
15 The box plots give information about the wages of a group of 16 year old workers and a group of 18 year old workers.
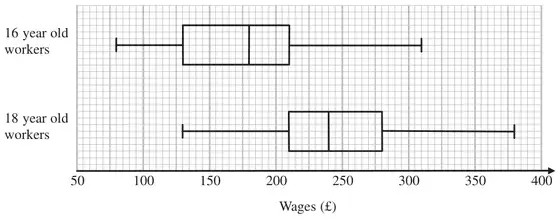
*(a) Compare the distribution of the wages of the 16 year old workers with the distribution of the wages of the 18 year old workers. (3)
There are 200 workers who are 16 years old.
(b) Work out an estimate for the number of these workers whose wages are £130 or more. (2)
| Working | Answer | Mark | Notes | ||||||||||||||||||||||||
|---|---|---|---|---|---|---|---|---|---|---|---|---|---|---|---|---|---|---|---|---|---|---|---|---|---|---|---|
| Compares: medians and spread | 3 | C1 for any correct comparison of the medians C1 for any correct comparison of the IQRs or the ranges C1 (dep on one C1) for either statement written in context |
| Answer | Mark | Notes |
|---|---|---|
| 150 | 2 | M1 for \(\dfrac{3}{4} \times 200\) oe A1 cao |