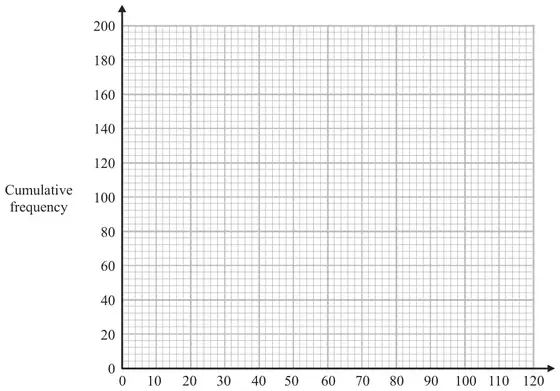
16 The table gives information about the marks gained by some students in an exam.
Mark (\(m\))
Frequency
\(0 \lt m \leqslant 20\)
40
\(20 \lt m \leqslant 40\)
70
\(40 \lt m \leqslant 60\)
60
\(60 \lt m \leqslant 80\)
15
\(80 \lt m \leqslant 100\)
10
\(100 \lt m \leqslant 120\)
5
(a) Complete the cumulative frequency table for this information.
Mark (\(m\))
Cumulative frequency
\(0 \lt m \leqslant 20\)
\(0 \lt m \leqslant 40\)
\(0 \lt m \leqslant 60\)
\(0 \lt m \leqslant 80\)
\(0 \lt m \leqslant 100\)
\(0 \lt m \leqslant 120\)
(1)
(b) On the grid, draw a cumulative frequency graph for your table.(2)
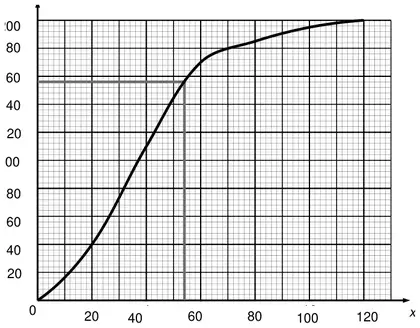
(c) Use your graph to find an estimate for the number of students who gained a mark of more than 54 (2)
Mark scheme (a)
Working
Answer
Mark
Notes
40, 110, 170, 185, 195, 200
Table
1
B1
Mark scheme (b)
Answer
Mark
Notes
Cumulative frequency diagram
2
M1 ft their cumulative frequency table for at least 5 points plotted correctly at the ends of the intervals provided tables values are cumulative, condoning one arithmetical error, or if the shape of the graph is correct for 5 or 6 points plotted not at the ends but consistently within each interval and joined. A1 for a correct graph (allow curve or line segments)
Mark scheme (c)
Answer
Mark
Notes
40 to 48
2
M1 for reading their cumulative frequency graph from mark of 54 (= 152 to 160) where the points are plotted consistently within each interval and joined. A1 for answer in the range 40 to 48 or ft from their cumulative frequency graph