
4MA0 Higher January 2018 Paper 4 Q12
12 The cumulative frequency graph gives information about the heights of 80 sunflowers.
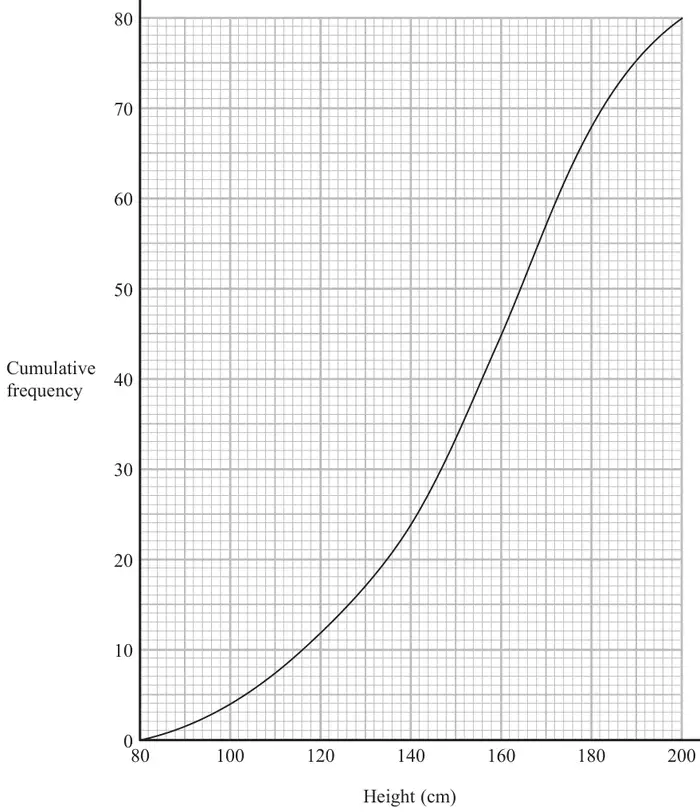
(a) Use the graph to find an estimate for the number of sunflowers with a height greater than 150 cm. (2)
(b) Use the graph to find an estimate for the median. (2)
| Scheme | Marks |
|---|---|
| 80 – “33” | M1 |
| 47 | A1 |
| (2) |
Notes
M1: for indication of correct reading from 150 cm and subtraction from 80 or a non-integer value in the range 46 - 47
A1: 46 or 47
| Scheme | Marks |
|---|---|
| M1 | |
| 156 | A1 |
| (2) |
Notes
M1: for using 40 or 40.5 on cumulative frequency axis eg indicated by horizontal line or dot on curve at correct place
A1: 155 - 157