
4MA0 Higher January 2018 Paper 3R Q16
16 The cumulative frequency graph gives information about the costs, in euros, of 120 holidays in Cyprus.
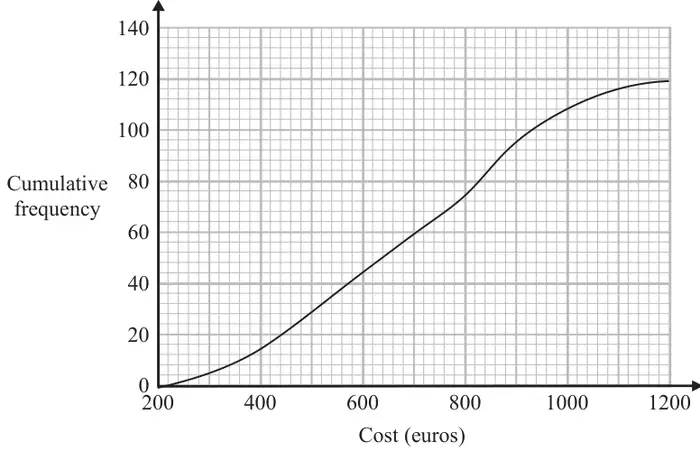
(a) Find an estimate for the median cost. (1)
(b) Find an estimate for the interquartile range of the costs. (2)
15% of these holidays had a cost greater than \(N\) euros.
(c) Use the graph to find an estimate for the value of \(N\). (3)
| Scheme | Marks |
|---|---|
| 700 | B1 |
| (1) |
Notes
B1: Answer in the range 700 - 720
| Scheme | Marks |
|---|---|
| eg \(Q_1 = 510\), eg \(Q_3 = 870\) | M1 |
| 360 | A1 |
| (2) |
Notes
M1: for a correct method to identify lower and upper quartiles eg readings from 30 and 90 from the vertical axis
A1: Answer in the range 330 - 380
| Scheme | Marks |
|---|---|
| \(\dfrac{85}{100} \times 120\) (= 102) or \(\dfrac{15}{100} \times 120\) (= 18) | M1 |
| M1 | |
| 940 | A1 |
| (3) |
Notes
M1: for using the graph to find the value of \(N\)
A1: 930 - 950