
4MA0 Higher January 2018 Paper 3 Q19
19 The table gives information about the distances, in kilometres, travelled by 120 people to get to an airport.
| Distance travelled (\(d\) km) | Frequency |
|---|---|
| \(0 \lt d \leqslant 10\) | 33 |
| \(10 \lt d \leqslant 25\) | 39 |
| \(25 \lt d \leqslant 45\) | 36 |
| \(45 \lt d \leqslant 60\) | 12 |
(a) On the grid below, draw a histogram for this information.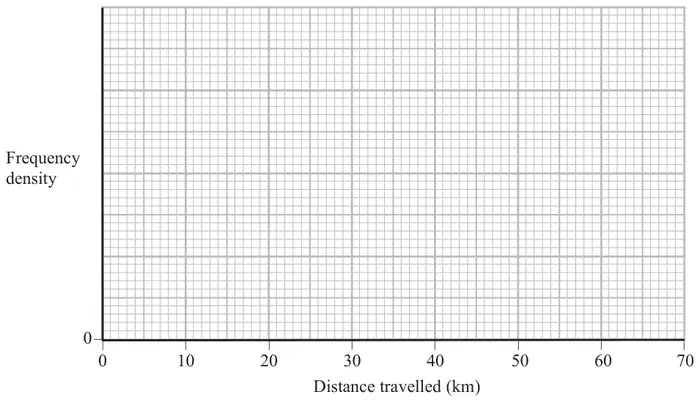
One of these people is to be selected at random.
(b) Find an estimate for the probability that this person travelled more than 30 km to get to the airport. (2)
| Scheme | Marks |
|---|---|
| 33 ÷ 10 (=3.3), 39 ÷ 15 (=2.6), 36 ÷ 20 (=1.8), 12 ÷ 15 (=0.8) | M1 |
| fd 3.3, 2.6, 1.8, 0.8 | M1 |
| A fully correct histogram | A1 |
| (3) |
Notes
M1: for use of area
e.g. correct method for any 2 frequency densities or
any 2 correct bars of different widths
M1: for at least 3 correct fd or
at least 3 correct bars
A1: for a correct histogram, with a linear scale on fd axis or a key
| Scheme | Marks |
|---|---|
| 0.75 × 36 + 12 (=39) | M1 |
| \(\dfrac{39}{120}\) | A1 |
| (2) |
Notes
M1: for a fully correct method to find number of people who travelled more than 30 km
A1: for \(\dfrac{39}{120}\) oe e.g. 0.325, 32.5%
Alternative method
| Scheme | Marks |
|---|---|
| E.g. “3.3” × 2 + “2.6” × 3 + “1.8” × 4 + “0.8” × 3 (= 24) and “1.8” × 3 + “0.8” × 3 (= 7.8) | M1 |
| \(\dfrac{39}{120}\) | A1 |
Notes
M1: dep on at least M1 in (a)
ft from their graph using area
A1: for \(\dfrac{39}{120}\) oe e.g. 0.325, 32.5%