
4MA0 Higher January 2018 Paper 3R Q20
20 The histogram gives information about the lengths, in millimetres, of 1875 snails.
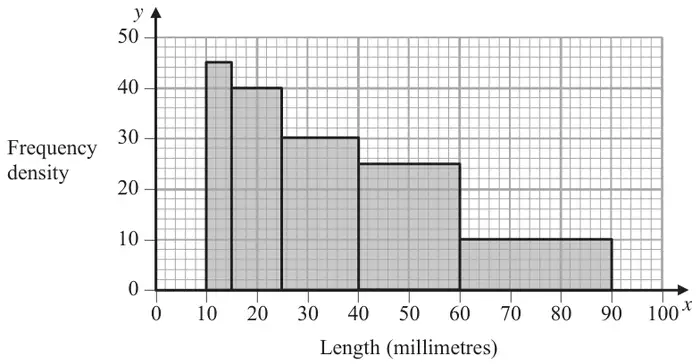
Calculate an estimate for the proportion of the snails more than 55 millimetres in length.
(3)
| Scheme | Marks |
|---|---|
| e.g. 5 × 25 (= 125) 10 × 10 × 3 (= 300) | M1 |
| Area from 55 to 90 is 5 × ‘25’ + 10 × 10 × 3 (= 425) | M1 |
| \(\dfrac{425}{1875}\) | A1 |
| (3) |
Notes
M1: for frequency found for any bar between 10 and 55 or between 55 and 90
M1: for a complete method to find the number of snails with lengths more than 55 mm
A1: oe