
S4 June 2010 Q3
3. A manager in a sweet factory believes that the machines are working incorrectly and the proportion \(p\) of underweight bags of sweets is more than 5%. He decides to test this by randomly selecting a sample of 5 bags and recording the number \(X\) that are underweight. The manager sets up the hypotheses \(\mathrm{H}_0 : p = 0.05\) and \(\mathrm{H}_1 : p \gt 0.05\) and rejects the null hypothesis if \(x \gt 1\).
The manager goes on holiday and his deputy checks the production by randomly selecting a sample of 10 bags of sweets. He rejects the hypothesis that \(p = 0.05\) if more than 2 underweight bags are found in the sample.
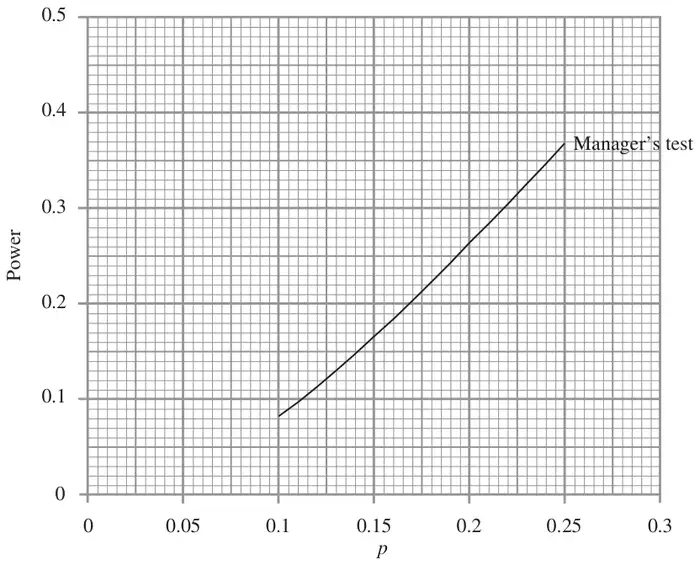
The table below gives some values, to 2 decimal places, of the power function for the deputy’s test.
| \(p\) | 0.10 | 0.15 | 0.20 | 0.25 |
|---|---|---|---|---|
| Power | 0.07 | \(s\) | 0.32 | 0.47 |
The graph of the power function for the manager’s test is shown in Figure 1.
The deputy suggests that they should use his sampling method rather than the manager’s.
| Scheme | Marks |
|---|---|
| \(X \sim \mathrm{B}(5, p)\) Size \(= \mathrm{P}(\text{reject }\mathrm{H}_0 / p = 0.05)\) \(= \mathrm{P}(X \gt 1 / p = 0.05)\) \(= 1 - 0.9774\) | M1 |
| \(= 0.0226\) | A1 |
| (2) |
Notes
M1 for finding \(\mathrm{P}(X \gt 1)\)
A1 awrt 0.0226
| Scheme | Marks |
|---|---|
| Power \(= 1 - \mathrm{P}(0) - \mathrm{P}(1)\) | M1 |
| \(= 1 - (1 - p)^5 - 5(1 - p)^4 p\) | M1 |
| \(= 1 - (1 - p)^4(1 - p + 5p)\) \(= 1 - (1 - p)^4(1 + 4p)\) | A1cso |
| (3) |
Notes
M1 for \(1 - \mathrm{P}(0) - \mathrm{P}(1)\)
M1 for \(1 - (1 - p)^5 - 5(1 - p)^4 p\)
A1 cso
| Scheme | Marks |
|---|---|
| \(Y \sim \mathrm{B}(10, p)\) \(\mathrm{P}(\text{Type I error}) = \mathrm{P}(Y \gt 2 / p = 0.05)\) | M1 |
| \(= 1 - 0.9885\) \(= 0.0115\) | A1 |
| (2) |
Notes
M1 for finding \(\mathrm{P}(Y \gt 2)\)
A1 awrt 0.0115
| Scheme | Marks |
|---|---|
| \(s = 0.18\) | B1 |
| (1) |
Notes
B1 0.18 cao
| Scheme | Marks |
|---|---|
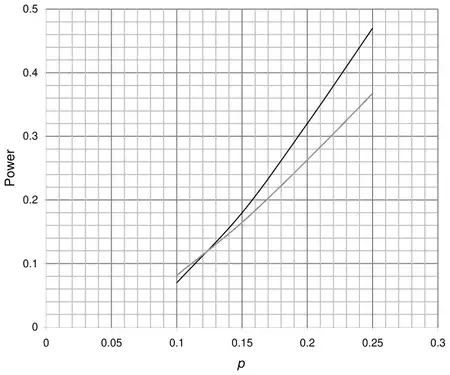 | B1ft |
| (1) |
Notes
B1 graph. ft their value of \(s\)
(In the printed scheme the deputy’s test is the darker, steeper curve, through 0.07 at \(p = 0.10\) and 0.47 at \(p = 0.25\).)
| Scheme | Marks |
|---|---|
| i intersection 0.12 – 0.13 “their graphs intersection” | B1ft |
| ii if \(p \gt 0.12\) the deputy’s test is more powerful. | B1 |
| (2) |
Notes
B1 ft their intersection.
B1 deputy test more powerful o.e.
| Scheme | Marks |
|---|---|
| More powerful for \(p \lt 0.12\) and \(p\) unlikely to be above 0.12 Allow it would cost more/take longer/more to sample | B1 |
| (1) | |
| (12 marks) |
Notes
If give first statement they must suggest \(p\) unlikely to be above 0.12
(The printed notes for (c) to (g) are labelled (a) to (e); they are shown here under the parts they belong to.)