
C4 June 2013 Q3
3.
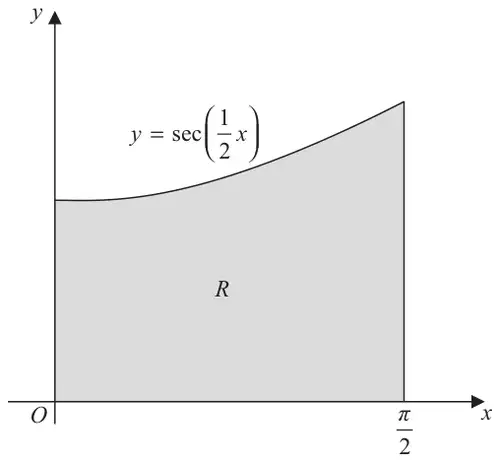
Figure 1 shows the finite region \(R\) bounded by the \(x\)-axis, the \(y\)-axis, the line \(x = \dfrac{\pi}{2}\) and the curve with equation \[y = \sec\left(\frac{1}{2}x\right), \quad 0 \leqslant x \leqslant \frac{\pi}{2}\]
The table shows corresponding values of \(x\) and \(y\) for \(y = \sec\left(\dfrac{1}{2}x\right)\).
| \(x\) | \(0\) | \(\dfrac{\pi}{6}\) | \(\dfrac{\pi}{3}\) | \(\dfrac{\pi}{2}\) |
|---|---|---|---|---|
| \(y\) | 1 | 1.035276 | 1.414214 |
Region \(R\) is rotated through \(2\pi\) radians about the \(x\)-axis.
| Scheme | Marks |
|---|---|
| 1.154701 | B1 cao |
| (1) |
Notes
B1: 1.154701 correct answer only. Look for this on the table or in the candidate’s working.
| Scheme | Marks |
|---|---|
| \(\text{Area} \approx \dfrac{1}{2} \times \dfrac{\pi}{6};\ \times \underline{\left[1 + 2\left(1.035276 + \text{their } 1.154701\right) + 1.414214\right]}\) | B1; M1 |
| \(= \dfrac{\pi}{12} \times 6.794168 = 1.778709023... = 1.7787\) (4 dp) 1.7787 or awrt 1.7787 | A1 |
| (3) |
Notes
B1: Outside brackets \(\dfrac{1}{2} \times \dfrac{\pi}{6}\) or \(\dfrac{\pi}{12}\) or awrt 0.262
M1: For structure of trapezium rule \(\left[\ \ldots\ldots\ldots\ldots\ \right]\)
A1: anything that rounds to 1.7787
Note: It can be possible to award : (a) B0 (b) B1M1A1 (awrt 1.7787)
Note: Working must be seen to demonstrate the use of the trapezium rule. Note: actual area is 1.762747174…
Note: Award B1M1A1 for \(\dfrac{\pi}{12}(1 + 1.414214) + \dfrac{\pi}{6}\left(1.035276 + \text{their } 1.154701\right) = 1.778709023...\)
Bracketing mistake: Unless the final answer implies that the calculation has been done correctly,
Award B1M0A0 for \(\dfrac{1}{2} \times \dfrac{\pi}{6} + 1 + 2\left(1.035276 + \text{their } 1.154701\right) + 1.414214\) (nb: answer of 7.05596...).
Award B1M0A0 for \(\dfrac{1}{2} \times \dfrac{\pi}{6}\,(1 + 1.414214) + 2\left(1.035276 + \text{their } 1.154701\right)\) (nb: answer of 5.01199...).
Alternative method for part (b): Adding individual trapezia
\(\text{Area} \approx \dfrac{\pi}{6} \times \left[\dfrac{1 + 1.035276}{2} + \dfrac{1.035276 + 1.154701}{2} + \dfrac{1.154701 + 1.414214}{2}\right] = 1.778709023...\)
B1: \(\dfrac{\pi}{6}\) and a divisor of 2 on all terms inside brackets.
M1: First and last ordinates once and two of the middle ordinates twice inside brackets ignoring the 2.
A1: anything that rounds to 1.7787
| Scheme | Marks |
|---|---|
| \(V = \pi\displaystyle\int_0^{\frac{\pi}{2}} \left(\sec\left(\dfrac{x}{2}\right)\right)^2 \mathrm{d}x\) For \(\pi\displaystyle\int \left(\sec\left(\dfrac{x}{2}\right)\right)^2\). Ignore limits and \(\mathrm{d}x\). Can be implied. | B1 |
| \(= \{\pi\}\left[2\tan\left(\dfrac{x}{2}\right)\right]_0^{\frac{\pi}{2}}\) \(\pm\lambda\tan\left(\dfrac{x}{2}\right)\) \(2\tan\left(\dfrac{x}{2}\right)\) or equivalent | M1 A1 |
| \(= 2\pi\) \(2\pi\) | A1 cao cso |
| (4) | |
| (8 marks) |
Notes
B1: For a correct statement of \(\pi\displaystyle\int \left(\sec\left(\dfrac{x}{2}\right)\right)^2\) or \(\pi\displaystyle\int \sec^2\left(\dfrac{x}{2}\right)\) or \(\pi\displaystyle\int \dfrac{1}{\left(\cos\left(\frac{x}{2}\right)\right)^2}\,\{dx\}\).
Ignore limits and \(\mathrm{d}x\). Can be implied.
Note: Unless a correct expression stated \(\pi\displaystyle\int \sec\left(\dfrac{x^2}{4}\right)\) would be B0.
M1: \(\pm\lambda\tan\left(\dfrac{x}{2}\right)\) from any working.
A1: \(2\tan\left(\dfrac{x}{2}\right)\) or \(\dfrac{1}{\left(\frac{1}{2}\right)}\tan\left(\dfrac{x}{2}\right)\) from any working.
A1: \(2\pi\) from a correct solution only.
Note: The \(\pi\) in the volume formula is only required for the B1 mark and the final A1 mark.
Note: Decimal answer of 6.283... without correct exact answer is A0.
Note: The B1 mark can be implied by later working – as long as it is clear that the candidate has applied \(\pi\displaystyle\int y^2\) in their working.
Note: Writing the correct formula of \(V = \pi\displaystyle\int y^2\{\mathrm{d}x\}\), but incorrectly applying it is B0.