
M1 June 2008 Q4
4. A car is moving along a straight horizontal road. The speed of the car as it passes the point \(A\) is 25 m s\(^{-1}\) and the car maintains this speed for 30 s. The car then decelerates uniformly to a speed of 10 m s\(^{-1}\). The speed of 10 m s\(^{-1}\) is then maintained until the car passes the point \(B\). The time taken to travel from \(A\) to \(B\) is 90 s and \(AB = 1410\) m.
(a) Sketch, in the space below, a speed-time graph to show the motion of the car from \(A\) to \(B\). (2)
(b) Calculate the deceleration of the car as it decelerates from 25 m s\(^{-1}\) to 10 m s\(^{-1}\). (7)
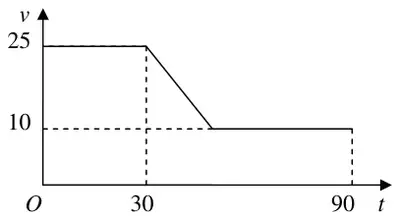
| Scheme | Marks |
|---|---|
| shape | B1 |
| 25, 10, 30, 90 | B1 |
| (2) |
| Scheme | Marks |
|---|---|
| \(30 \times 25 + \underline{\tfrac{1}{2}(25 + 10)t} + 10(60 - t) = 1410\) | M1 A1 A1 |
| \(7.5t = 60\) | |
| \(t = 8\ \ (\text{s})\) | DM1 A1 |
| \(a = \dfrac{25 - 10}{8} = 1.875\ \left(\text{ms}^{-2}\right)\) \(1\tfrac{7}{8}\) | M1 A1 |
| (7) | |
| (9 marks) |