
S1 June 2012 Q5
5.
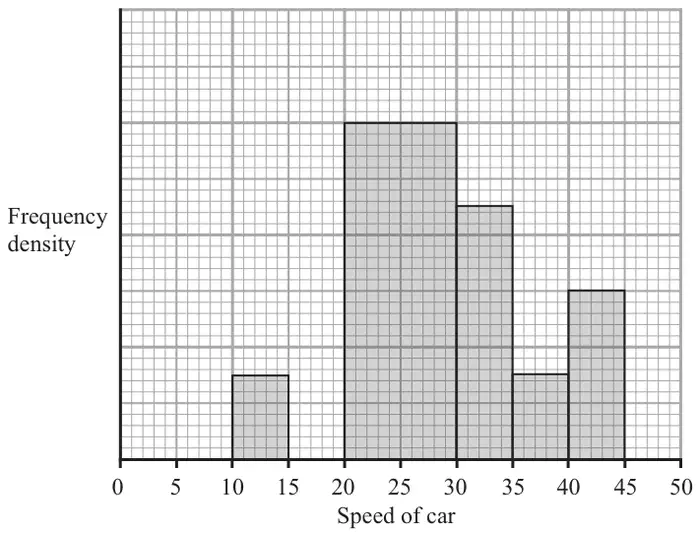
A policeman records the speed of the traffic on a busy road with a 30 mph speed limit. He records the speeds of a sample of 450 cars. The histogram in Figure 2 represents the results.
| Scheme | Marks |
|---|---|
| One large square \(= \dfrac{450}{\text{"}22.5\text{"}}\) or one small square \(= \dfrac{450}{\text{"}562.5\text{"}}\) (o.e. e.g. \(\dfrac{\text{"}562.5\text{"}}{450}\)) | M1 |
| One large square = 20 cars or one small square = 0.8 cars or 1 car = 1.25 squares | A1 |
| No. > 35 mph is: \(4.5\times\text{"}20\text{"}\) or \(112.5\times\text{"}0.8\text{"}\) (or equivalent e.g. using fd) | dM1 |
| \(=\) 90 (cars) | A1 |
| (4) |
Notes
1st M1 for attempt to count squares (accept “22.5” in [22, 23] and “562.5” in [550, 575]) and use 450 to obtain a measure of scale. [If using fd must use 450 to obtain scale factor]
1st A1 for a correct calc. for 20 or 0.8 or 1.25 etc
[ May be fd = 4 to 1 large sq. or 0.8 to 1 small sq. May be on the diagram.]
2nd dM1 dep on 1st M1 for correctly counting squares for > 35 mph and forming suitable expr’
2nd A1 for 90 with no incorrect working seen.
e.g. \(\dfrac{4.5}{22.5}\times 450\) scores M1A1M1 and A1 when = 90 is seen. Answer only is 4/4
| Scheme | Marks |
|---|---|
| \([\bar{x}] = \dfrac{30\times 12.5 + 240\times 25 + 90\times 32.5 + 30\times 37.5 + 60\times 42.5}{450} \quad \left[= \dfrac{12975}{450}\right]\) | M1 M1 |
| \(= 28.83\ldots\) or \(\dfrac{173}{6}\) awrt 28.8 | A1 |
| (3) |
Notes
1st M1 for clear, sensible use of mid-points at least 3 of (12.5, 25, 32.5, 37.5, 42.5) seen
2nd M1 for an expression for \(\bar{x}\) (at least 3 correct terms on num’ and a compatible denominator). Follow through their frequencies.
You may see these fractions: \(\frac{16218.75}{562.5}\) (small squares), \(\frac{12975}{450}\) (frequencies), \(\frac{648.75}{22.5}\) (large squares)
A1 for awrt 28.8 (answer only is 3/3)
| Scheme | Marks |
|---|---|
| \([Q_2 =]\ 20 + \dfrac{195}{240}\times 10\) (o.e.) [Allow use of \((n + 1)\) giving 195.5 instead of 195] | M1 |
| \(= 28.125\) [Use of \((n + 1)\) gives 28.145…] awrt 28.1 | A1 |
| (2) |
Notes
M1 for a full expression for median (using their frequencies). May see e.g. \(25 + \dfrac{75}{120}\times 5\) etc. Do nor accept boundaries of 19.5 or 20.5, these are M0A0
A1 for awrt 28.1 (answer only is 2/2) [For use of \((n + 1)\) accept 28.15 but not 28.2]
| Scheme | Marks |
|---|---|
| \(Q_2 \lt \bar{x}\) [Condone \(Q_2 \approx \bar{x}\)] | B1ft |
| So positive skew [ so (almost) symmetric ] | dB1ft |
| (2) |
Notes
1st B1ft for a correct statement about their \(Q_2\) and \(\bar{x}\) [Condone \(Q_2 \approx \bar{x}\) only if \(|Q_2 - \bar{x}| \lt 1\)]. Do not accept an argument based on the shape of the graph alone.
2nd dB1ft dependent on 1st B1 for a compatible description of skewness. F.t. their values
Quartiles If \(Q_1 = 23.4\) and \(Q_3 = 33.7 \sim 33.8\) are seen allow comparison of quartiles for 1st B1 in (d)
| Scheme | Marks |
|---|---|
| [If chose skew in (d)] median (\(Q_2\)) [If chose symmetric in (d)] mean (\(\bar{x}\)) | B1 |
| Since the data is skewed or median not affected by extreme values [Since it uses all the data] | dB1 |
| (2) | |
| (13 marks) |
Notes
1st B1 for a correct choice based on their skewness comment in (d). If no choice made in (d) only \(Q_2\)
2nd dB1 for a suitable compatible comment