
S1 June 2013 Q2
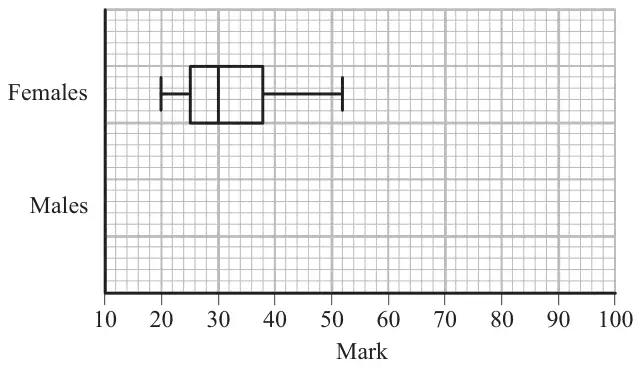
2. The marks of a group of female students in a statistics test are summarised in Figure 1
The marks of a group of male students in the same statistics test are summarised by the stem and leaf diagram below.
| Mark | (2|6 means 26) | Totals |
|---|---|---|
| 1 | 4 | (1) |
| 2 | 6 | (1) |
| 3 | 4 4 7 | (3) |
| 4 | 0 6 6 7 7 8 | (6) |
| 5 | 0 0 1 1 1 3 6 7 7 | (9) |
| 6 | 2 2 3 3 3 8 | (6) |
| 7 | 0 0 8 | (3) |
| 8 | 5 | (1) |
| 9 | 0 | (1) |
An outlier is a mark that is
either more than \(1.5\,\times\) interquartile range above the upper quartile
or more than \(1.5\,\times\) interquartile range below the lower quartile.
| Scheme | Marks |
|---|---|
| 25 (allow any \(x\) where \(24 \lt x \lt 26\)) | B1 |
| (1) |
| Scheme | Marks |
|---|---|
| \(\mathbf{Q_2}\) ( or median or \(m\) ) = 51 | B1 |
| IQR = 63 – 46 ,= 17 (or \(\mathrm{Q}_3 - \mathrm{Q}_1 = 17\)) | M1, A1 |
| (3) |
Notes
Mark (b) and (c) together BUT must see clear statement that median (or \(m\) or \(Q_2\)) = 51 and IQR = 17
M1 for 2 quartiles (at least one correct) and attempt to find the difference. Must see their 63 – their 46
A1 for 17 only. [Answer only of IQR= 17 scores M1A1]
| Scheme | Marks |
|---|---|
| Outliers given by \(46 - 1.5\times 17 = 20.5\) or \(63 + 1.5\times 17 = 88.5\) | M1 |
| Outliers limits are 20.5 and 88.5 | A1 |
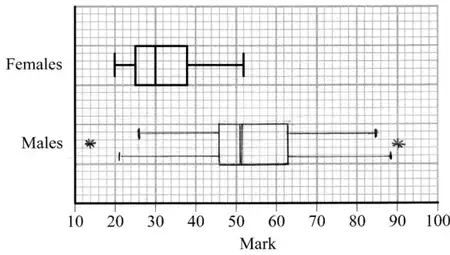 Do not allow a mix of whiskers e.g 20.5 and 85 Do not allow both sets of whiskers | M1 A1ft B1 |
| (5) |
Notes
A fully correct box-plot (either version) with no supporting work scores 5/5. Otherwise:
1st M1 for correct attempt to calc’ at least one limit for outliers, ft their quartiles or IQR or award for sight of 20.5 or 88.5
1st A1 for identifying both limits of 20.5 and 88.5
2nd M1 for a box with an upper and a lower whisker(s) with at least 2 correct values (or correct ft) (condone no median marked) (condone 2 upper or 2 lower whiskers)
2nd A1ft for their 20.5 or 26 ,46, 51, 63 and 85 or their 88.5 in appropriate places and readable off their scale. Follow through their 20.5 and their 88.5 only, other values need to be correct. If there are 2 upper or 2 lower whiskers A0
B1 for only 2 outliers appropriately marked at 14 and 90 Do not award if whiskers go beyond these values.
Apply \(\pm\) 0.5 square accuracy for diagram
A box plot not on the graph paper can only score the 1st M1A1
| Scheme | Marks |
|---|---|
| Medians: Median for females lower than males IQR: IQR for females smaller than males. Allow “lower/higher” but not “wider” Range: Range of females is less than males Skewness: Male and female marks are both positively skew Ignore other statements about average, spread, mean, st. Dev, variation, outliers etc | B1ft B1ft |
| (2) | |
| (11 marks) |
Notes
In (d) ft from their diagrams (if no diagram then use their values)
1st B1ft for one correct comment comparing median, IQR , range or skewness
2nd B1ft for a second correct comment comparing median, IQR, range or skewness. Do not allow contradictory statements