
C3 June 2014 (R) Q7
7.
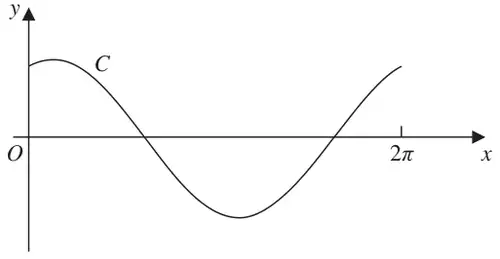
Figure 1 shows the curve \(C\), with equation \(y=6\cos x+2.5\sin x\) for \(0\leqslant x\leqslant 2\pi\)
A student records the number of hours of daylight each Sunday throughout the year. She starts on the last Sunday in May with a recording of 18 hours, and continues until her final recording 52 weeks later.
She models her results with the continuous function given by\[H=12+6\cos\left(\frac{2\pi t}{52}\right)+2.5\sin\left(\frac{2\pi t}{52}\right),\qquad 0\leqslant t\leqslant 52\]where \(H\) is the number of hours of daylight and \(t\) is the number of weeks since her first recording.
Use this function to find
[You must show your working. Answers based entirely on graphical or numerical methods are not acceptable.]
(6)| Scheme | Marks |
|---|---|
| \(R=\sqrt{\left(6^2+2.5^2\right)}=6.5\) | B1 |
| \(\tan\alpha=\dfrac{2.5}{6},\quad\Rightarrow\quad\alpha=\) awrt \(0.395\) | M1A1 |
| (3) |
Notes
B1 \(R=6.50,\ \dfrac{13}{2}\). Accept \(R=\) awrt 6.50. Do not accept \(R=\pm 6.50\)
M1 For reaching \(\tan\alpha=\pm\dfrac{2.5}{6}\) or \(\tan\alpha=\pm\dfrac{6}{2.5}\).
If R has been attempted first then only accept \(\sin\alpha=\pm\dfrac{2.5}{\text{'}R\text{'}}\) or \(\cos\alpha=\pm\dfrac{6}{\text{'}R\text{'}}\)
A1 Correct value \(\alpha=\) awrt 0.395. The answer in degrees \(22.6^\circ\) is A0
| Scheme | Marks |
|---|---|
| \((0,6)\), | B1 |
| awrt \((1.97,0)\quad(5.11,0)\) | M1A1 |
| (3) |
Notes
B1 The correct y intercept. Accept \(y=6\), \((0,6)\), awrt \(y=6.00\), \(\mathrm{f}(0)=6\) or it marked on the curve.
Do not accept \((6,0)\)
M1 Attempt to find either \(x\) intercept from \(\dfrac{\pi}{2}+\) their 0.395, or \(\dfrac{3\pi}{2}+\) their 0.395
If the candidate is working in degrees accept \(90+\) their 22.6 or \(270+\) their 22.6
One answer correct will imply this.
A1 Both answers correct. Accept awrt \((1.97,0)\) and \((5.11,0)\), Accept \(x=1.97\) and \(x=5.11\) or both being marked on the curve. Do not accept \((0,1.97)\) and \((0,5.11)\) for both marks
In degrees accept \((112.6,0)\) and \((292.6,0)\)
| Scheme | Marks |
|---|---|
| \(H_{\max}=18.5,\ H_{\min}=5.5\) | M1A1A1 |
| (3) |
Notes
M1 Attempts either \(12+\text{'}R\text{'}\) OR \(12-\text{'}R\text{'}\)
A1 Either of 18.5 or 5.5. Accept one of these for two marks
A1 Both 18.5 and 5.5.
Accept for 3 marks answers just written down with limited or no working.
Attempted answers via differentiation will be few and far between but can score 3 marks.
M1 Differentiates to \(H'=\pm A\sin\left(\dfrac{2\pi t}{52}\right)\pm B\cos\left(\dfrac{2\pi t}{52}\right)\), followed by \(H'=0\)
\(\Rightarrow\tan\left(\dfrac{2\pi t}{52}\right)=\left(\dfrac{5}{12}\right)\Rightarrow t=\) awrt 3.2.., 29.2...
For the M to be scored they need to sub one value of t (which may not be correct) into \(H=\)
A1 Either of 18.5 or 5.5. A1 Both 18.5 and 5.5.
| Scheme | Marks |
|---|---|
| Sub \(H=16\) and proceed to \(\text{'}6.5\text{'}\cos\left(\dfrac{2\pi t}{52}\pm\text{'}0.395\text{'}\right)=4\) | M1 |
| \(\left(\dfrac{2\pi t}{52}-\text{'}0.395\text{'}\right)=\) awrt \(0.91\) | A1 |
| \(t=\left(\text{awrt }0.908\pm\text{'}0.395\text{'}\right)\times\dfrac{52}{2\pi}=11\ (10.78)\) | dM1A1 |
| \(\left(\dfrac{2\pi t}{52}\pm\text{'}0.395\text{'}\right)=\text{awrt }2\pi-0.908\Rightarrow t=48\ (47.75)\) | ddM1A1 |
| (6) | |
| (15 marks) |
Notes
M1 Substitutes \(H=16\) into the equation for \(H\) and proceeds to \(\text{'}6.5\text{'}\cos\left(\dfrac{2\pi t}{52}\pm\text{'}0.395\text{'}\right)=4\)
Accept for this mark \(\text{'}6.5\text{'}\cos\left(x\pm\text{'}0.395\text{'}\right)=4\)
A1 A correct intermediate line, which may be implied by a correct final answer. Follow through on their numerical value of \(\alpha\)
Accept in terms of ‘\(t\)’ \(\left(\dfrac{2\pi t}{52}-\text{'}0.395\text{'}\right)=\) awrt 0.91 or in terms of ‘\(x\)’ \(\left(x-\text{'}0.395\text{'}\right)=\) awrt 0.91
Accept in terms of ‘\(t\)’ \(\left(\dfrac{2\pi t}{52}-\text{'}0.395\text{'}\right)=\text{invcos}\,\dfrac{4}{6.5}\)
dM1 A full method to find one value of \(t\). It is dependent upon the previous M mark having been awarded.
Accept \(t=\left(\text{their }0.908\pm\text{'}0.395\text{'}\right)\times\dfrac{52}{2\pi}\).
Don't be overly concerned with the mechanics of this but the '0.395' the \(2\pi\) and the 52 must have been used to find \(t\).
A1 One correct value of \(t\) with a correct solution. Both M's must have been scored.
Accept awrt 10.7/10.8 or 11 or 47.7/47.8 or 48.
ddM1 A full method to find a secondary value of \(t\). It is dependent upon both previous M's.
\(\left(\dfrac{2\pi t}{52}\pm\text{their '}0.395\text{'}\right)=\text{awrt }2\pi-\text{their }0.91\Rightarrow t=..\)
Don't be overly concerned with the mechanics of this but the '0.395' the \(2\pi\) and the 52 must have been used to find \(t\).
A1 Accept 11 and 48 coming from awrt 10.8/10.7 and 47.7/47.8. Both values of \(t\) need to be correct and have been rounded from \(t\) values that were correct to 1 dp. The intermediate values can be implied by seeing the whole calculation as written out in the mark scheme
Answers obtained by graphical or numerical means are not acceptable.
Answers obtained from degrees are perfectly acceptable only if degrees were used throughout (d) with \(\pi\), being replaced by \(180^\circ\) in the formula and the answers in degrees converted back to radians at the end.
Mixed units can only score the first M1A1
\(6.5\cos\left(\dfrac{2\pi t}{52}-\text{'}22.6\text{'}\right)=4\Rightarrow\left(\dfrac{2\pi t}{52}-\text{'}22.6\text{'}\right)=\text{awrt }52.0\)