
C3 June 2013 (R) Q2
2.
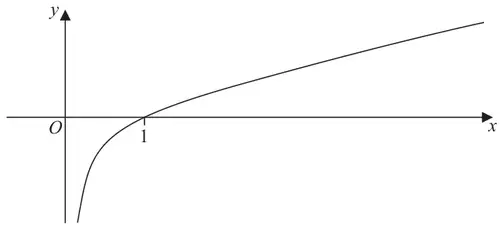
Figure 1 shows a sketch of the curve with equation \(y=\mathrm{f}(x)\), \(x>0\), where f is an increasing function of \(x\). The curve crosses the \(x\)-axis at the point \((1,0)\) and the line \(x=0\) is an asymptote to the curve.
On separate diagrams, sketch the curve with equation
Indicate clearly on each sketch the coordinates of the point at which the curve crosses or meets the \(x\)-axis.
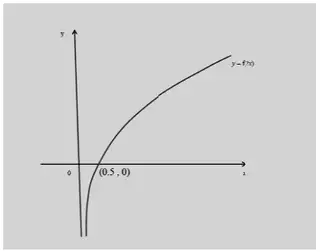
| Scheme | Marks |
|---|---|
| Shape | B1 |
| \((0.5,0)\) | B1 |
| (2) |
Notes
B1 Award for the correct shape. Look for an increasing function with decreasing gradient. Condone linear looking functions in the first quadrant. It needs to look asymptotic at the \(y\) axis and have no obvious maximum point. It must be wholly contained in quadrants 1 and 4
See practice and qualification items for clarification.
B1 Crosses \(x\) axis at \(\left(\dfrac{1}{2},0\right)\). Accept \(\dfrac{1}{2}\), 0.5 or even \(\left(0,\dfrac{1}{2}\right)\) marked on the correct axis.
There must be a graph for this mark to be scored.
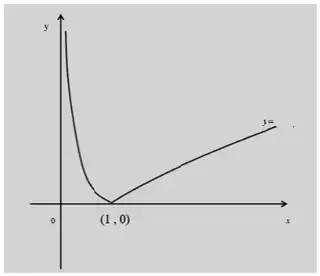
| Scheme | Marks |
|---|---|
| Shape | B1 |
| \((1,0)\) | B1 |
| Cusp at \((1,0)\) | B1 |
| (3) | |
| (5 marks) |
Notes
B1 Correct shape wholly contained in quadrant 1.
The shape to the rhs of the cusp must not have an obvious maximum.
Accept linear, or positive with decreasing gradient. The gradient of the curve to the lhs of the cusp/minimum should always be negative. The curve in this section should not ‘bend’ back past \((1,0)\) forming a ‘C’ shape or have incorrect curvature.
See practice and qualification for clarification.
B1 The curve touches or crosses the \(x\) axis at \((1,0)\). Allow for the curve passing through a point marked ‘1’ on the \(x\) axis. Condone the point marked on the correct axis as \((0,1)\)
B1 Award for a cusp, not a minimum at \((1,0)\)
Note that \(\mathrm{f}\left(|x|\right)\) scores B0 B1 B0 under the scheme.
If the graphs are not labelled (a) and (b), then they are to be marked in the order they are presented