
C4 June 2009 Q2
2.
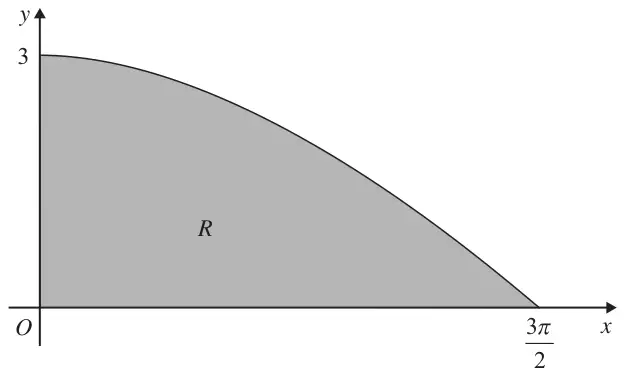
Figure 1 shows the finite region \(R\) bounded by the \(x\)-axis, the \(y\)-axis and the curve with equation \(y = 3\cos\left(\dfrac{x}{3}\right),\ 0 \leqslant x \leqslant \dfrac{3\pi}{2}\).
The table shows corresponding values of \(x\) and \(y\) for \(y = 3\cos\left(\dfrac{x}{3}\right)\).
| \(x\) | 0 | \(\dfrac{3\pi}{8}\) | \(\dfrac{3\pi}{4}\) | \(\dfrac{9\pi}{8}\) | \(\dfrac{3\pi}{2}\) |
|---|---|---|---|---|---|
| \(y\) | 3 | 2.77164 | 2.12132 | 0 |
(a) Complete the table above giving the missing value of \(y\) to 5 decimal places. (1)
(b) Using the trapezium rule, with all the values of \(y\) from the completed table, find an approximation for the area of \(R\), giving your answer to 3 decimal places. (4)
(c) Use integration to find the exact area of \(R\). (3)
| Scheme | Marks |
|---|---|
| 1.14805 awrt 1.14805 | B1 |
| (1) |
| Scheme | Marks |
|---|---|
| \(A \approx \dfrac{1}{2} \times \dfrac{3\pi}{8}(\ \ldots\ )\) | B1 |
| \(= \ldots\ \big(3 + 2(2.77164 + 2.12132 + 1.14805) + 0\big)\) 0 can be implied | M1 |
| \(= \dfrac{3\pi}{16}\big(3 + 2(2.77164 + 2.12132 + 1.14805)\big)\) ft their (a) | A1ft |
| \(= \dfrac{3\pi}{16} \times 15.08202\ldots = 8.884\) cao | A1 |
| (4) |
| Scheme | Marks |
|---|---|
| \(\displaystyle\int 3\cos\left(\frac{x}{3}\right)\mathrm{d}x = \frac{3\sin\left(\frac{x}{3}\right)}{\frac{1}{3}}\) \(= 9\sin\left(\dfrac{x}{3}\right)\) | M1 A1 |
| \(A = \left[9\sin\left(\dfrac{x}{3}\right)\right]_0^{\frac{3\pi}{2}} = 9 - 0 = 9\) cao | A1 |
| (3) | |
| (8 marks) |