
C3 June 2008 Q3
3.
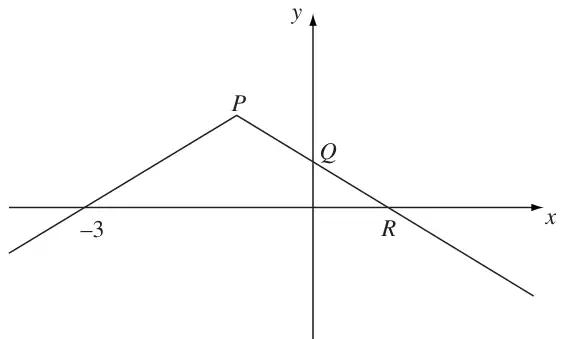
Figure 1 shows the graph of \(y = \mathrm{f}(x)\), \(x \in \mathbb{R}\).
The graph consists of two line segments that meet at the point \(P\).
The graph cuts the \(y\)-axis at the point \(Q\) and the \(x\)-axis at the points \((-3, 0)\) and \(R\).
Sketch, on separate diagrams, the graphs of
(a) \(y = |\mathrm{f}(x)|\), (2)
(b) \(y = \mathrm{f}(-x)\). (2)
Given that \(\mathrm{f}(x) = 2 - |x + 1|\),
(c) find the coordinates of the points \(P\), \(Q\) and \(R\), (3)
(d) solve \(\mathrm{f}(x) = \dfrac{1}{2}x\). (5)
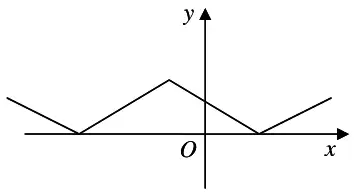
| Scheme | Marks |
|---|---|
| \(\vee\!\vee\) shape | B1 |
| Vertices correctly placed | B1 |
| (2) |
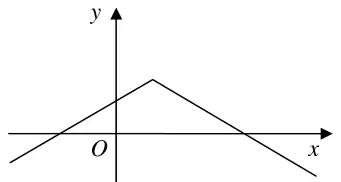
| Scheme | Marks |
|---|---|
| \(\wedge\) shape | B1 |
| Vertex and intersections with axes correctly placed | B1 |
| (2) |
| Scheme | Marks |
|---|---|
| \(P : (-1, 2)\) | B1 |
| \(Q : (0, 1)\) | B1 |
| \(R : (1, 0)\) | B1 |
| (3) |
| Scheme | Marks |
|---|---|
| \(x > -1;\quad 2 - x - 1 = \dfrac{1}{2}x\) | M1 A1 |
| Leading to \(x = \dfrac{2}{3}\) | A1 |
| \(x < -1;\quad 2 + x + 1 = \dfrac{1}{2}x\) | M1 |
| Leading to \(x = -6\) | A1 |
| (5) | |
| (12 marks) |